
- SUI price gained over 11.52% in the last 24 hours, jumping from $2.17 to $2.42 before settling at $2.39.
- The altcoin faces multiple rejections at $2.50, preventing further upside.
The cryptocurrency market has witnessed a 3.04% rebound, sparking renewed optimism across various assets, attempting to drag them back to their former highs. However, the push is not strong enough, market sentiment remains cautious, with the Fear and Greed Index lingering at 22, signaling widespread fear. Volatility continues, especially for Bitcoin, which has seen deep losses, struggling between $83K and $84K. However, leading altcoins like SUI are seeing some green in its chart.
SUI has shown notable resilience, gaining momentum during the Asian trading hours. The asset surged over 11.52% in the past 24 hours, climbing from a low of $2.17 to an intraday high of $2.42 before slightly retracing to $2.39 at press time. The daily trading volume has soared to $779.75 million, while liquidations have eased, with $1.20 million being wiped out in the last 24 hours.
However, The altcoin has been in a downtrend since mid-February due to the global market crash, shedding 7.39% in the past week and 33% over the past month. SUI lost more than 55% from its all-time high of $5.35, recorded in early January. This downtrend has prevented the altcoin from breaking its resistance level and hindered further upward movement. With this situation, SUI has struggled to break past the key resistance at $2.50 facing repeated rejections at this level.
SUI Price Technical Indicators Signal Uncertainty
The current recovery attempts of SUI have failed, and the downtrend continues. In the 4-hour SUI/USDT chart, SUI’s price is above the 21-day and 50-day EMA, indicating short-term and mid-term bullish momentum. However, it is below the 100-day EMA, suggesting that the overall trend still faces resistance in the longer term.
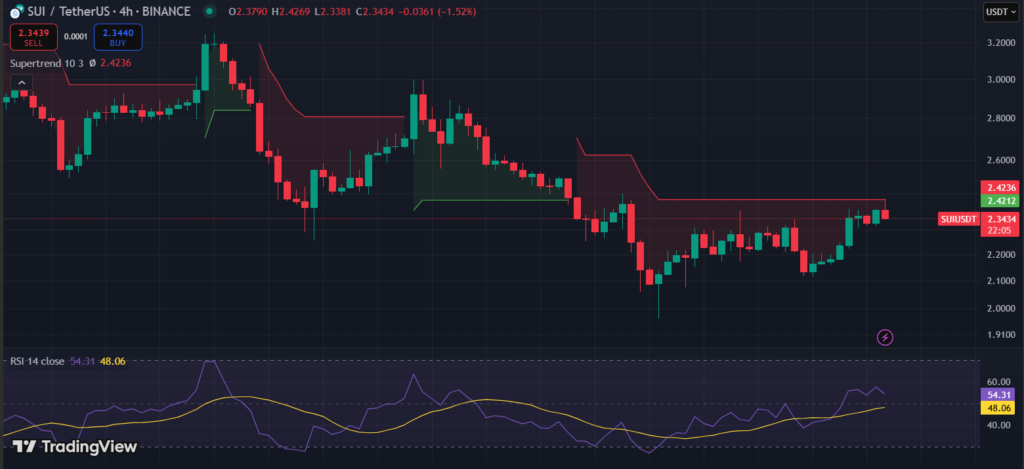
Zooming in, the Supertrend indicator has turned red, signaling potential selling pressure, while the RSI at 54 indicates neutral to slightly bullish momentum. Additionally, the MACD line above the signal line suggests growing buying pressure, but the mixed signals highlight the possibility of another pullback.
If SUI fails to hold its current levels, it could revisit crucial support zones at $2.10 and $1.85. A breakdown below these levels might lead to deeper losses. On the flip side, if buying pressure increases, SUI could retest $2.50. Breaking this resistance might propel the asset toward $2.85, with extended gains potentially pushing it toward $3.50 and beyond.
Spot SUI ETF Speculation Gains Traction
As Sui’s ecosystem continues to expand, discussions about a spot SUI ETF in the U.S. have started gaining momentum. Currently, VanEck offers a Sui Exchange-Traded Note (ETN) in Europe via Deutsche Börse and Euronext. While not the same as a spot ETF, its success could encourage firms like Canary Capital to explore a U.S.-based option in the near future.
With SUI showing signs of recovery, analysts remain cautiously optimistic about its next move. Will it break through resistance or face another rejection? The coming days will be crucial in determining the asset’s trajectory.