

- SPX6900 breaks above $1.63 resistance after months of consolidation, gaining over 500% from March lows of $0.26.
- A golden cross with 50-day EMA crossing above 200-day EMA indicates a potential long-term uptrend ahead.
The meme coin market has been burning with speculation, yet not many tokens have shown the technical ability that SPX6900 (SPX) is showing right now. Following several months of consolidation and accumulation, this digital asset seems to be setting up a major breakout. This would redefine its trend and draw the interest of both retail and institutional traders.
The SPX6900 price action tells an interesting story of a recovery and gaining momentum. After a massive drop off in the levels in early 2025 of about $1.68, the token held solid support at around $0.26 in March. This support area was indeed vital since it was the start of an extended period of recovery. SPX has now seen a break above the $1.63 resistance area, and gains of more than 500% above the March lows.
As per CMC data, SPX is currently trading at $1.603 with an intraday 9%, showcasing bullishness. Moreover, the trading volume is also increasing, currently standing at $106.94 million, showing buyers’ presence.
What’s Next for SPX Price?
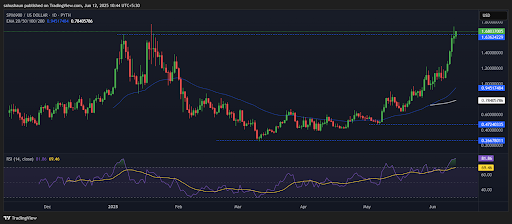
The exponential moving averages are developing an increasingly bullish scenario on SPX6900. The 50-day EMA has crossed convincingly above the 200-day EMA, showcasing a golden cross. The golden cross indicates the trend is turned bullish and investors could expect a rally in altcoin soon.
Investors are seeing great bullish divergence in momentum indicators on several timeframes. The MACD histogram is trending higher in positive momentum as the MACD line is trading significantly above the signal line.
The Awesome Oscillator has entered the positive zone, which shows that the buying momentum is gaining. Most importantly, the RSI indicator value of 81.86 indicates that the token may be overbought. It demonstrated two scenarios, a period of consolidation, or the price may continue moving higher.
The volume profile on this breakout stage has been specifically promising, as high volume has continued to accompany the price move. This is an indication of real purchasing demand as opposed to a pump.
The fact that the $1.63 resistance area was finally broken and served as a major obstacle in the past opens the possibilities to reach the $2 mark and beyond. Traders must, however, be wary of the overbought RSI level and the possible profit-taking pressure at these levels.
Highlighted Crypto News Today:
Financial Adviser Caught in Crypto Scam, Banned for a Decade