
- Sonic’s (S) price has decreased by 33% over last week.
- S crypto price is in the bear’s grip trading below the key EMA levels.
Sonic has fallen significantly since the start of February’s end, a drop that resumed in March and dropped 33% this week. Key indicators such as MACD and RSI also suggest bearish momentum as both are trading in bearish territory.
S crypto price touched a high of $0.98 on 21 February and halted from there as buyers failed to maintain the bullish momentum. The sellers took control of the trend, pulling the price below the key EMA levels.
According to CoinMarketCap data, at the time of writing Sonic’s crypto price is trading at $0.5304 with an intraday drop of 24% indicating strong bearishness. The daily trading volume has decreased by 9% suggesting bearish momentum and the volume-to-market ratio is 19.27%. Moreover, the market cap is $1.54 billion and the 24-hour trading volume is $293.59 million.
Will Sonic’s (S) Price Break From Bearish Grip?
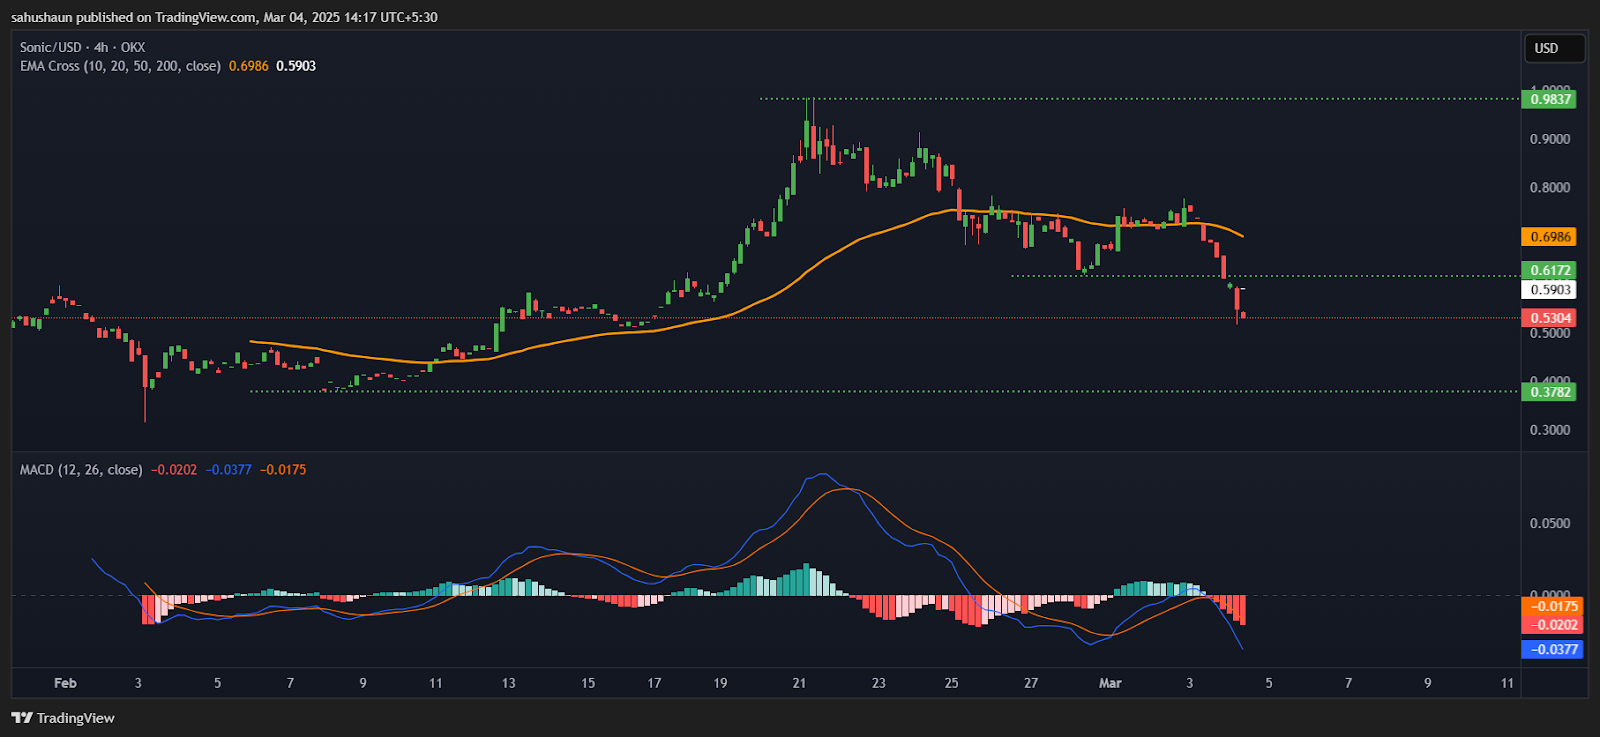
Sonic crypto price is trading below the key 20-day and 50-day EMA levels, showcasing bearishness. A death cross is also visible on the technical chart between the 20-day and 50-day EMAs.
S price is heading towards the lower support levels of $0.4464 and $0.3782. Over the last month, Sonic crypto has experienced bearish momentum, fading all the previous gains. Additionally, it dropped 33.36% over a week, demonstrating extreme bearishness.
The weak market sentiments also gave a push to the bearish momentum in Sonic crypto. Moreover, MACD is also trading in the bearish territory with a red histogram, suggesting bear dominance.
Furthermore, the trading view technical summary also supports the bearish analysis. As per the technical summary, out of 17 indicators 11 are on the sell side, 6 are on the neutral side and zero are on the buying side, suggesting a strong sell signal.