
- Despite favorable market momentum, including meme coin growth, the Solana price has been declining for a week.
- Solana’s price has dropped in the last 7 days.
- Technical indicators suggest a potential breakout for Solana, with a break below $160 leading to a drop towards $150.
Despite the presence of favorable market momentum, including the growth of meme coins, the approval of an ETF, a community governance vote for validators, and PayPal’s launch of the PYUSD stablecoin on the Solana network, the Solana (SOL) price has been on a declining trend for the past week.
Solana, the leading meme coin network, experienced a drop on May 30, from $176.8 to $165, accompanied by a shift from a bullish to a neutral zone in technical and moving average indicators.
Solana Faces Downward Pressure
Market movements are generally influenced by multiple factors, and in the case of Solana, the fundamentals appear to be in favor. However, the SOL price has dropped in the last 7 days.
Despite the highly volatile market, Ethereum’s ETF approval has uplifted Solana, leading to a surge of nearly 21.7% in the last month. The current price action reflects a slight correction, indicating high volatility, increased selling pressure, and downward moving volume.
However, SOL has demonstrated resilience by maintaining its position above previous support zones and showing no clear intention of breaking in either direction.
The current technical indications suggest that a breakout is imminent for Solana, with the direction to be determined by sellers.
Technical Indicators Predict Strong Movement
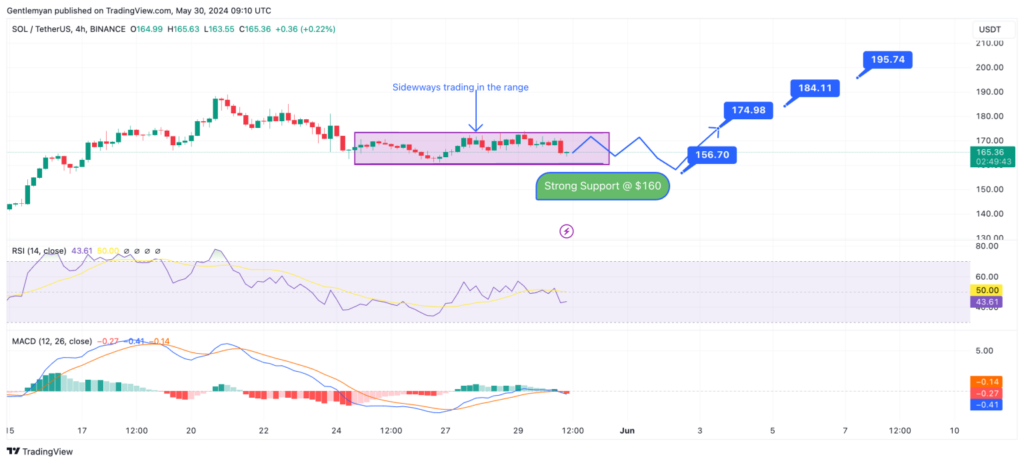
If the current price continues to break below $160, Solana’s price is expected to follow the lead towards the $150 zone. In contrast, additional purchasing pressure might assist recapture the $170 level and spark an upward advance to $185 and $200.
The 4-hour SOL/USDT chart reveals a sideways pattern with a mixed outlook. The Relative Strength Index (RSI) reading at 50 indicates that the price is trading in a neutral zone, with no overbought or oversold conditions. Similarly, the Moving Average Convergence Divergence (MACD) represents a crossover in neutral territory.
The sideways chart pattern is typically considered a neutral zone for price and presents an opportunity for traders to place positions.