
- Solana is currently trading at the $90 mark.
- SOL has seen $11.60M in 24-hour liquidations.
Solana (SOL) is showing signs of a potential short squeeze, which happens when traders betting against the price are forced to buy back as the price rises. Recently, it reclaimed the $93.14 level, which had acted as a resistance zone for about 39 days. This shift suggests that the market structure is changing, with that former resistance now potentially acting as support.
While many traders were expecting further downside, this move caught the market off guard. If SOL manages to hold above this level, it could build confidence among buyers and trigger stronger upward momentum. The mentioned targets at $102.67 and $113.16 represent the next key areas where the price could move if the bullish momentum continues.

Currently, Solana has posted a loss of over 3.94%, and it trades around the $90.53 range. Moreover, the daily trading volume has decreased by over 33.72%, reaching the $3.79 billion mark. Concurrently, the market has experienced an $11.60 million worth of Solana liquidation over the past 24 hours, as reported by the Coinglass data.
Assuming the Solana bears strengthen their grip, the price might slip and test the support at the $88.36 range. If the downside correction continues, the death cross could take place and trigger the price below $86.59. Upon the bulls entering, the Solana price could climb to the resistance level at $92.72. An upside pressure might potentially push the golden cross out and extend the gains to its former high at around $94.73.
Solana’s Technical Chart Signals Further Downside
The Moving Average Convergence Divergence (MACD) line is below the signal line, but both are above the zero line. It indicates the SOL market is still in an uptrend but losing momentum. Notably, the recent strength is starting to fade, and the sellers are pushing back.
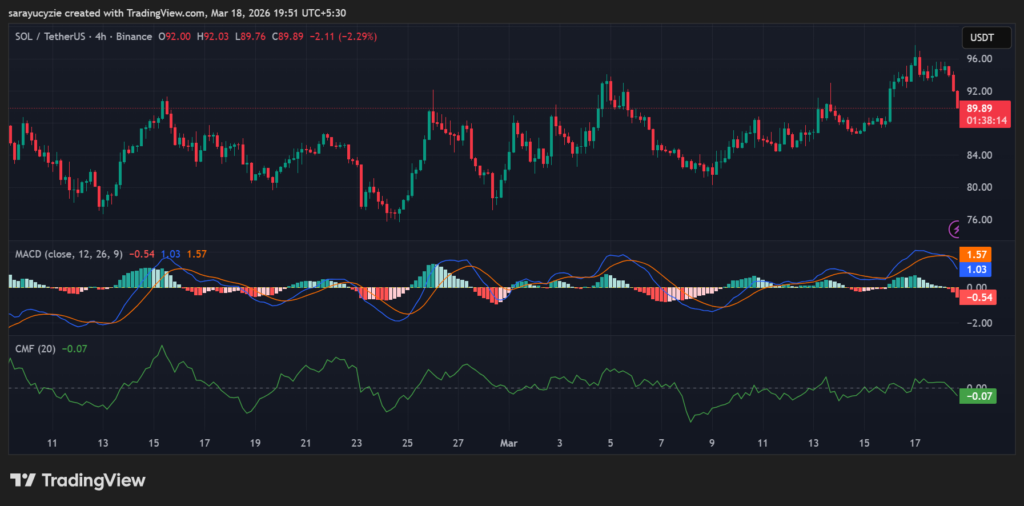
Besides, the Chaikin Money Flow (CMF) indicator is positioned at -0.07, suggesting mild selling pressure. Money is flowing out more than in, so the sellers have a small edge. The move is not strong, but it shows weakness in buying interest and sideways action.
Solana’s daily Relative Strength Index (RSI) is found at 41.59 implies a slight bearish bias. As it is below the neutral mark, the sellers have control, but the momentum is not strong. If the value drops further, it builds downside pressure, while a move back above 50 hints at buyers stepping in.
Moreover, the Bull Bear Power (BBP) reading of -4.45 points to strong bearish pressure, pushing the price below its average level. It reflects clear downside momentum and weak buying support. The market may keep trending lower if the value continues to drop.
Top Updated Crypto News
Humanity Protocol Weakens: Will the 6% Loss Trigger a Deeper Slide?