- Solana shows signs of bullish reversal, aiming for $150 and potentially $169.
- Rounding bottom pattern and double-bottom reversal evident in 4-hour chart.
- Key resistance levels at $149.32 and $158.49, with support at $130.
Solana (SOL) finds itself at a pivotal juncture as the cryptocurrency market’s broader recovery begins to decelerate. Despite this slowdown, underlying sentiment remains cautiously optimistic for the upcoming month, with Solana positioning itself for a potential breakout run.
As Bitcoin and other top altcoins hover near crucial levels, all eyes are on SOL’s ability to overcome key resistances and drive a bullish trend.
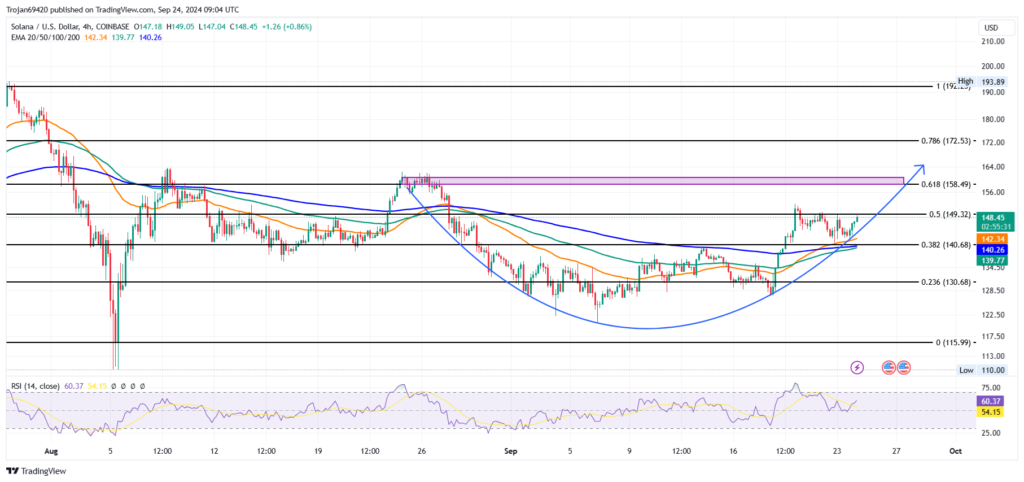
The 4-hour chart reveals a compelling rounding-bottom reversal pattern, signaling a potential shift in Solana’s price trajectory. This formation’s neckline aligns with the 61.80% Fibonacci retracement level at $158.49, presenting a significant hurdle for bulls to overcome.
Adding weight to the bullish case, a golden crossover between the 50 and 200 exponential moving averages (EMAs) has materialized, with an impending bullish crossover between the 100 and 200 EMAs on the horizon.
Solana forms double bottom reversal pattern

Further bolstering the bullish narrative, a double-bottom reversal pattern has emerged within the $140 to $149 consolidation range. The neckline of this formation coincides with the 50% Fibonacci level at $149.32, creating a confluent resistance zone that bulls must breach to confirm the reversal.
Should Solana successfully overcome these barriers, price targets at the 78.60% and 100% Fibonacci levels ($172 and $192, respectively) come into focus.
However, market participants must remain cognizant of potential downside risks. Failure to surpass the critical $149 level could undermine the rounding-bottom reversal scenario, potentially leading to a retest of support around the 23.60% Fibonacci level near $130. This support zone represents a crucial bulwark against deeper retracements.
Zooming out to the daily timeframe, Solana’s price action reveals a series of lower highs, forming a descending resistance line. Notable double-top reversals occurred near $200 in March, $183 in July, and $159 in August.
Despite these setbacks, the recent rounding reversal pattern suggests resilient bullish momentum. Since finding support in the $117 demand zone, SOL has staged an impressive 18.50% recovery over the past 18 days.


