- Recent investors hold 27% of Solana supply in 6-12 month bracket
- Realized price at $133.34 suggests room for appreciation
- Technical analysis points to potential $290 target by year-end
The dynamics of Solana’s investor base have undergone a significant transformation, with data revealing that investors who entered the market in the past 6 to 12 months now control an impressive 27% of the total supply. This shift in ownership structure tells us something important about market sentiment and potential future price action.
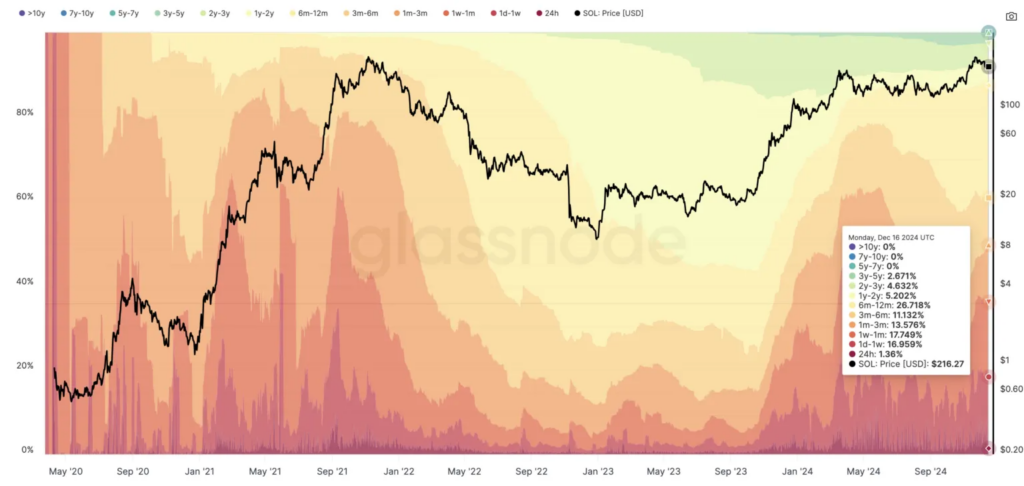
Analyzing Solana Holder Distribution Through HODL Waves
The Realized Cap HODL Waves provide a fascinating window into investor behavior by showing us how SOL tokens are distributed across different holding periods.
Recent data reveals a compelling story: 26% of supply sits in the 6-12 month bracket, while 13% and 11% belong to the 3-6 month and 1-3 month cohorts, respectively. This concentration of holdings among newer investors suggests growing confidence in Solana’s long-term prospects.

The significance of this distribution becomes clearer when we consider that longer-term Solana holders (1-5 years) control a relatively smaller portion of supply. This pattern indicates that more recent investors are choosing to adopt longer-term holding strategies, potentially reducing available supply in the market.
The relationship between current market price and realized price provides another layer of insight. With Solana’s realized price at $133.34, substantially below the current trading price, we can see that the average acquisition cost of all tokens remains well below market value.
This gap between realized and market price often indicates healthy market conditions and potential for continued appreciation.
The daily chart of Solana reveals a bull flag formation, a technical pattern that typically precedes continuation of the previous upward trend. After an initial decline to $213.64, the price has recovered to $219.95, suggesting the pattern may be preparing to resolve higher.
A breach of the flag’s upper boundary could target $290 before year-end, with some analysts, including VanEck, projecting potential moves toward $500 in highly optimistic scenarios.


