
- Raydium’s price dropped 40% in a week due to Pump.fun’s AMM speculation and increased supply.
- Key indicators like MACD and RSI show strong bearish sentiment, predicting further decline.
Raydium crypto price has fallen 40% over the last week showcasing bearish sentiment. This sudden price drop occurred after an on-chain sleuth stated that Pump.fun is developing an Automated Market Maker (AMM). This incident caused a loss of $334 million in market capitalization and an increase in exchange supply.
Since then the RAY token has been witnessing high volatility dropping like a falling knife on the technical chart. According to CMC data, the Raydium crypto price has been down by 62.60% over the last month and 40% over the last week. It has already broken the major support level of $4.12 and is decreasing further.
At the time of writing, Raydium’s crypto price is trading at $2.4928 with an intraday drop of 10.87%. The daily trading volume is down by almost 28% and the volume to market cap ratio is at 44.64%. Its market cap stands at $724.49 million and the 24-hour trading volume is $313.73 million.
Will Raydium’s Price Continue to Fall?
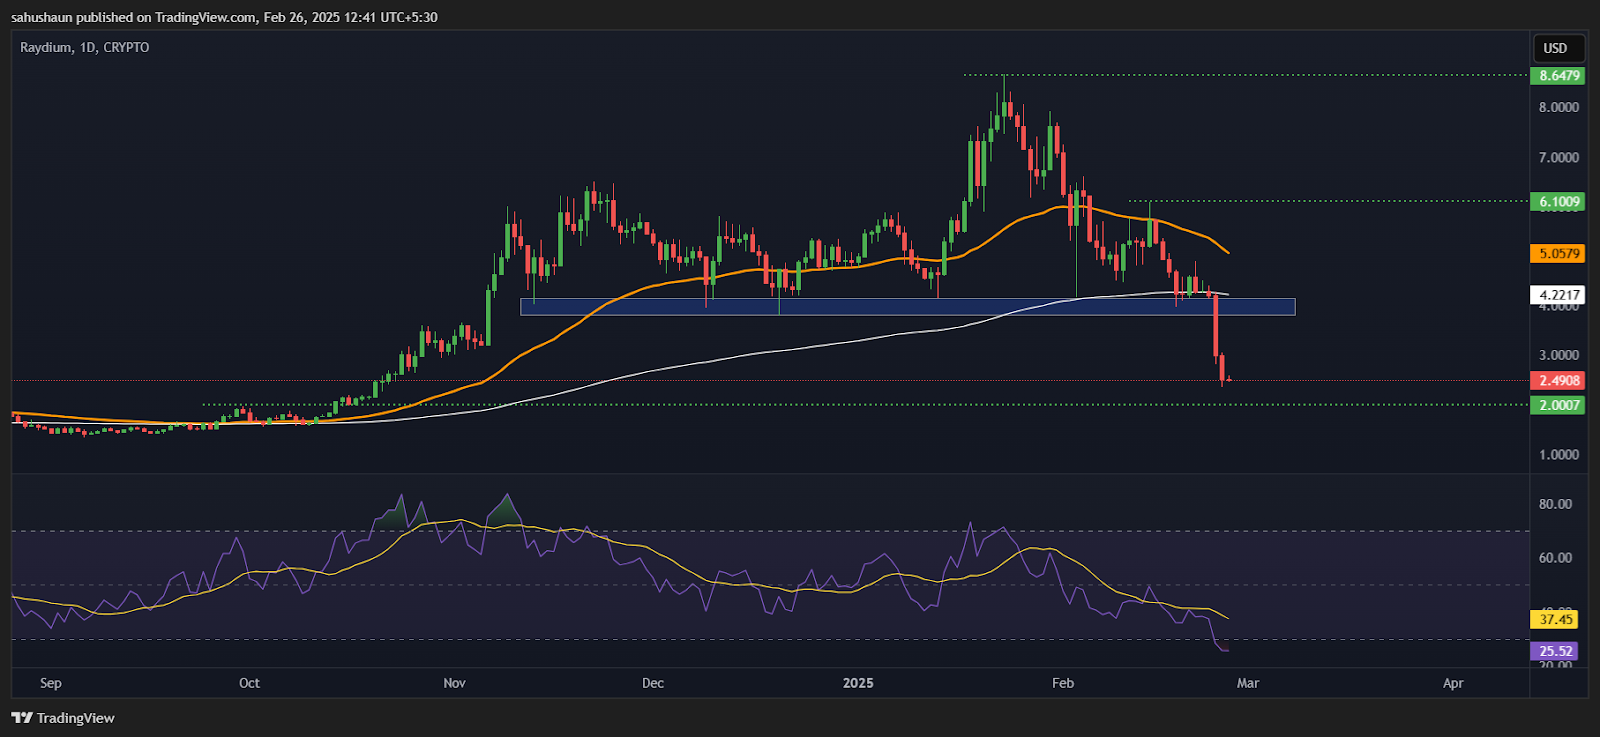
Raydium crypto price broke below the key exponential moving averages of 50-day and 200-day indicating a bearish trend. The RAY price touched the high of $8.647 in January end and then halted from there as buyers couldn’t maintain the bullish trend.
Key indicators such as MACD and RSI are also in the bearish territory. The RSI curve is at 25.50 below the 14-day SMA curve and the MACD curve is heading downward with red histograms showcasing strong bearishness.
The next support levels of Raydium price are at $2.007 and $1.4245. However, the trading view technical summary indicates a strong sell signal. As per the technical summary, out of 25 indicators, 15 are on the sell side, 8 are on the neutral side and 2 are on the buy side.
Highlighted Crypto News Today:
PayPal is Set to Boost its Stablecoin PYUSD Adoption in 2025