In Quantum Coin QTUM Technical Analysis 2021, we use past statistics, Price Patterns, RSI, and various other QTUM information to analyze the future trend of cryptocurrencies.
Qtum (pronounced “Quantum”) is an open source Proof-of-Stake (PoS) smart contract blockchain platform and value transfer protocol. Its goal is to combine the advantages of Bitcoin and Ethereum in one chain. UTXO transaction model with smart contract execution and DApps additional functions. The platform recently added support for DeFi applications.
The project was announced in March 2016, and a year later, in March 2017, an ICO was conducted, raising $15 million for its founder. The Qtum main chain was started on September 13, 2017. Qtum coins were initially issued in the form of ERC20 tokens, but with the launch of the mainnet, it was converted to native blockchain.
Quantum Coin (QTUM) Current Market Status
According to CoinGecko, the QTUM price is trading at $9.3 with a 24-hour trading volume of $285,666,630, at the time of writing. However, QTUM has increased by 5.5% in the last 24 hours.
Moreover, QTUM has a circulating supply of 103,482,795 QTUM. Currently, QTUM trades in Binance, Huobi Global, OKEx, FTX, and BitForex.
Quantum Coin QTUM Technical Analysis 2021
The recent development and upgrades might push Quantum Coin (QTUM) to reach new heights. Now, let’s deep dive into the Quantum Coin QTUM Technical Analysis 2021. The weekly and daily time frame chart with two views of the pattern of Quantum (QTUM) as shown below.
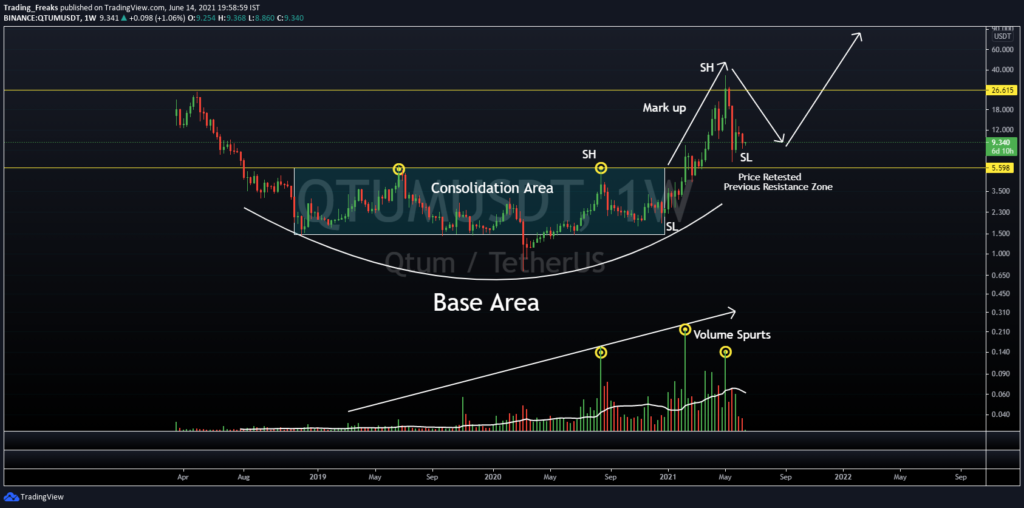
The weekly time frame chart shows the “Consolidation Phase” from 2018 to 2020 in which cryptos are traded within a certain range ($1.5 – $5.5). This indicates a strong base area for QTUM. Initially, volume is dry for QTUM, after 2021, it has been increased (Volume Spurts) which shows that more buyers are active in this token. Then the price breached the resistance level of $5.520 and entered into the Markup zone and made an All-time high. After the Strong Rejection at Resistance area, the price plummeted to the previous Resistance area ($5.5) that indicates in the above chart. Moreover, there is a chance to hit the price range between $40 – $50, if more traders show interest to buy this token.
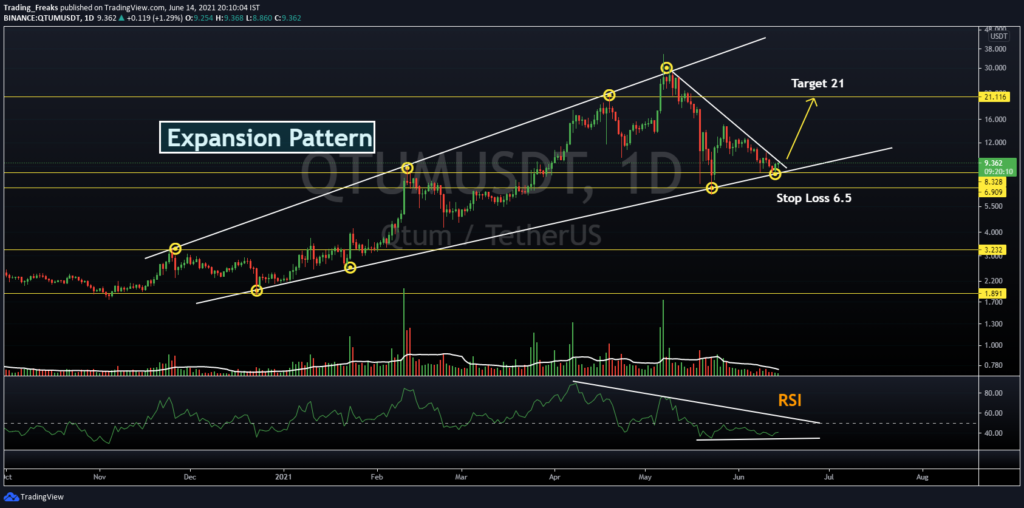
The daily time frame chart shows the Expansion pattern of QTUM. This pattern indicates the price of QTUM is traded at the trendline support level. If the token breaks the trendline resistance level means it will reach the target of $21.
Quantum Coin (QTUM) RSI, RVOL, and MA
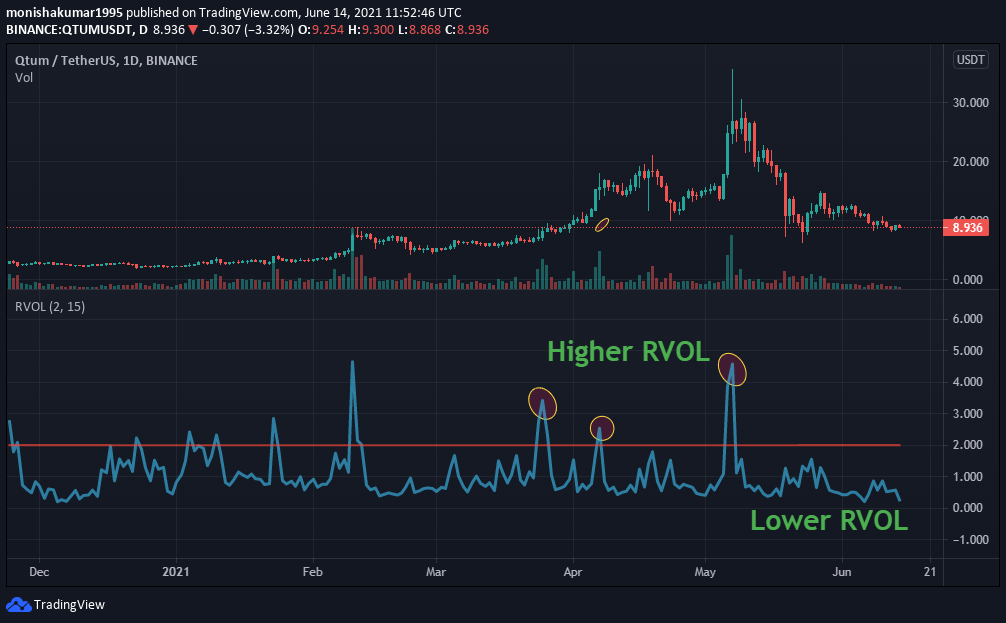
The below chart shows the Relative Volume (RVOL) of QTUM. Generally, Relative trading volume is a trading indicator, used by day traders to compare the current trading volume with the normal trading volume in the past. Notably, in March, April, and the start of May, it is found that the RVOL stays three times above the cut-off line making a Higher RVOL. From mid of May month to till at the time of writing, the RVOL stays below the cut-off line which indicates the weaker participants in the trend .
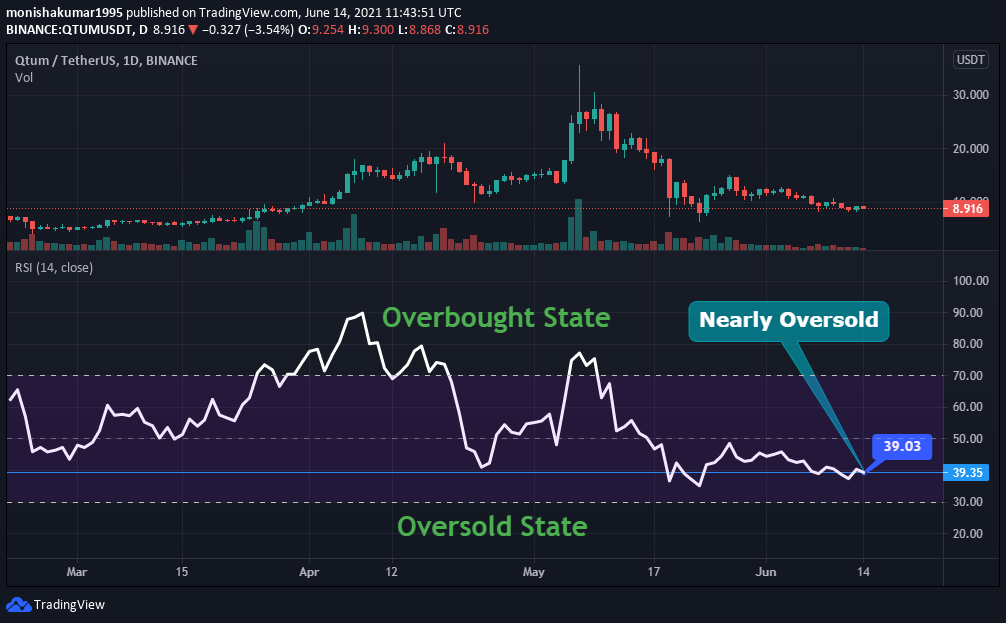
Now let’s look at the relative strength index (RSI) of QTUM. As shown in the below chart, RSI remains at 39. This shows that QTUM’s price is in a nearly oversold state. However, this shows that major price reversal could occur in the upcoming days. So, traders need to trade carefully.
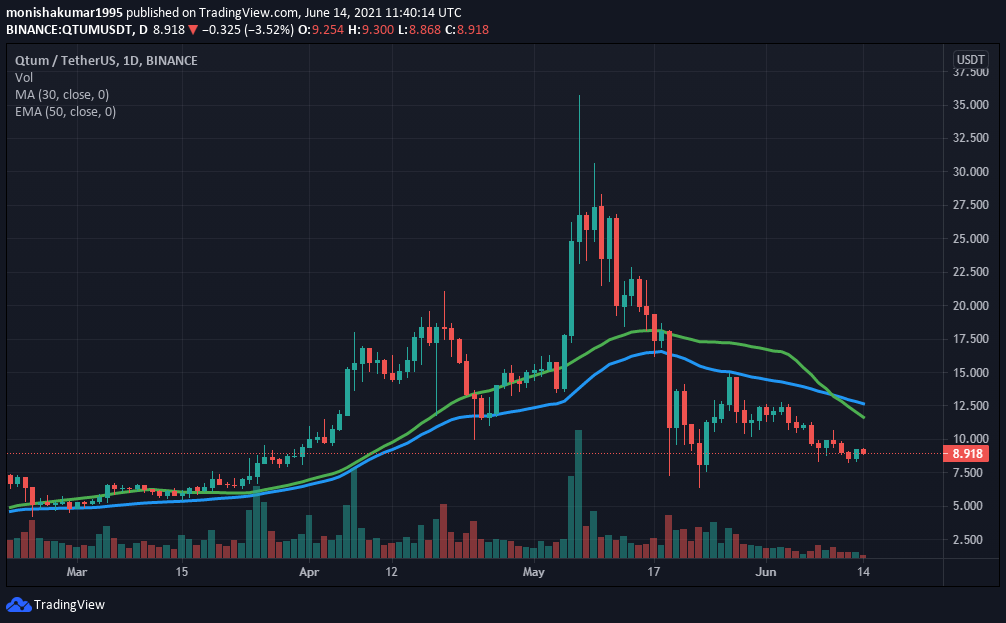
QTUM’s Moving Average (MA) and Exponential Moving Average (EMA) as shown in the chart below. MA is a crypto indicator widely used in technical analysis. The reason for calculating the crypto moving average is to smooth the price data over a period of time by creating a constantly updated average price. While EMA is a type of moving average.
From the beginning of 2021, it is clear that the QTUM price has shown many bullish patterns. Furthermore, taking all these into account, QTUM could have a competitive market in 2021.
Conclusion
With the ongoing developments and upgrades that are taking place within the QTUM platform. The cryptocurrency QTUM has a fantastic future ahead in this crypto market. However, it is possible to see QTUM reaching new heights.
Bullish QTUM price prediction 2021 is $20. As said above, it may reach great heights, however reaching $50, if investors have decided that QTUM is a good investment in 2021.
FAQ
Qtum is a decentralized open-source smart contract platform. The Qtum value transfer protocol uses proof-of-stake consensus, which means that node operators get rewards by verifying transactions. Its native coin is QTUM.
QTUM is listed on many cryptocurrency exchanges that include Binance, Huobi Global, OKEx, FTX, and BitForex. It is available for trading against crypto fiat coins, stablecoins, and other cryptocurrencies.
With the ongoing developments and upgrades within the QTUM platform, it has the high possibility of reaching its ATH soon.
Disclaimer: The opinion expressed in this chart solely author’s. It does not interpreted as investment advice. TheNewsCrypto team encourages all to do their own research before investing.
Recommended Article