- Bullish QTUM price prediction for 2025 is $4.921 to $15.097.
- Qtum (QTUM) price might reach $16 soon.
- Bearish QTUM price prediction for 2025 is $0.781.
In this Qtum (QTUM) price prediction 2025, 2026-2030, we will analyze the price patterns of QTUM by using accurate trader-friendly technical analysis indicators and predict the future movement of the cryptocurrency.
TABLE OF CONTENTS |
INTRODUCTION |
|
Qtum (QTUM) PRICE PREDICTION 2025 |
|
| Qtum (QTUM) PRICE PREDICTION 2026, 2027-2030 |
| CONCLUSION |
| FAQ |
Qtum (QTUM) Current Market Status
| Current Price | $2.14 | 24 – Hour Price Change | 4.52% Down |
| 24 – Hour Trading Volume | $88.69M |
| Market Cap | $226.39M |
| Circulating Supply | 105.71M QTUM | All – Time High | $106.88 ( On Jan 07, 2018) |
| All – Time Low | $0.77 (On March 13, 2020) |
What is Qtum (QTUM)?
| TICKER | QTUM |
| BLOCKCHAIN | Qtum |
| CATEGORY | Platform token |
| LAUNCHED ON | March 2017 |
| UTILITIES | Governance, security, gas fees & rewards |
Qtum is a hybrid blockchain project that combines the best part of Bitcoin and Ethereum. It supports smart contracts on the Ethereum Virtual Machine. It uses Bitcoin’s UTXO model with a proof-of-stake consensus. It is known for its decentralized validation of transactions, which allows any individual to validate without particular “validators”.
Furthermore, the cryptocurrency launched in March 2017, runs on its own blockchain. The blockchain supports multiple token standards. In 2023, the prominent L1 ecosystem Tenet partnered with Qtum. However, recently, the project has not shown much activity until the recent day’s price surge.
Qtum (QTUM) 24H Technicals
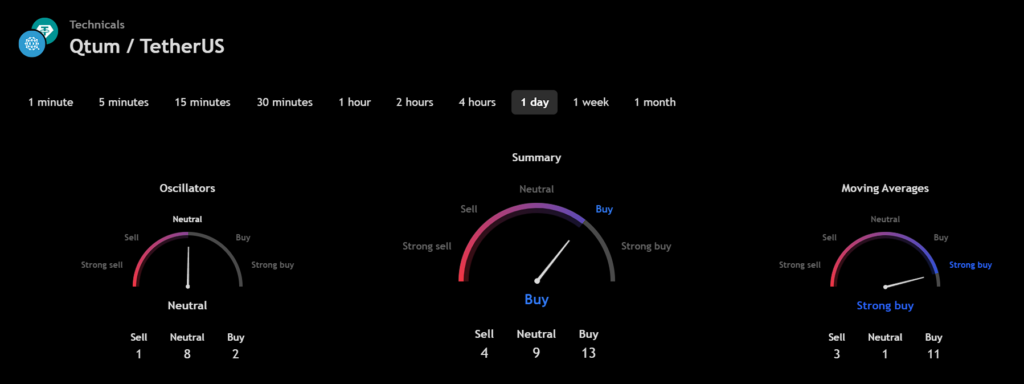
(Source: TradingView)
Qtum (QTUM) Price Prediction 2025
Qtum (QTUM) ranks 177nd on CoinMarketCap in terms of its market capitalization. The overview of the Qtum price prediction for 2025 is explained below with a daily time frame.
In the above chart, Qtum (QTUM) laid out a horizontal channel pattern also known as the sideways trend. In general, the horizontal channel is formed during the price consolidation. In this pattern, the upper trendline, the line which connects the highs, and the lower trendline, the line which connects the lows, run horizontally parallel and the price action is contained within it.
A horizontal channel is often regarded as one of the suitable patterns for timing the market as the buying and selling points are in consolidation.
At the time of analysis, the price of Qtum (QTUM) was recorded at $2.14. If the pattern trend continues, then the price of QTUM might reach the resistance levels of $3.427, $5.869, and $17.216. If the trend reverses, then the price of QTUM may fall to the support of $1.992.
Qtum (QTUM) Resistance and Support Levels
The chart given below elucidates the possible resistance and support levels of Qtum (QTUM) in 2025.
From the above chart, we can analyze and identify the following as the resistance and support levels of Qtum (QTUM) for 2025.
| Resistance Level 1 | $4.921 |
| Resistance Level 2 | $15.097 |
| Support Level 1 | $1.837 |
| Support Level 2 | $0.781 |
Qtum (QTUM) Price Prediction 2025 — RVOL, MA, and RSI
The technical analysis indicators such as Relative Volume (RVOL), Moving Average (MA), and Relative Strength Index (RSI) of Qtum (QTUM) are shown in the chart below.
From the readings on the chart above, we can make the following inferences regarding the current Qtum (QTUM) market in 2025.
| INDICATOR | PURPOSE | READING | INFERENCE |
| 50-Day Moving Average (50MA) | Nature of the current trend by comparing the average price over 50 days | 50 MA = $3.177 Price = $3.302 (50MA < Price) | Bullish/Uptrend |
| Relative Strength Index (RSI) | Magnitude of price change;Analyzing oversold & overbought conditions | 52.552 <30 = Oversold 50-70 = Neutral >70 = Overbought | Neutral |
| Relative Volume (RVOL) | Asset’s trading volume in relation to its recent average volumes | Below cutoff line | Weak Volume |
Qtum (QTUM) Price Prediction 2025 — ADX, RVI
In the below chart, we analyze the strength and volatility of Qtum (QTUM) using the following technical analysis indicators — Average Directional Index (ADX) and Relative Volatility Index (RVI).
From the readings on the chart above, we can make the following inferences regarding the price momentum of Qtum (QTUM).
| INDICATOR | PURPOSE | READING | INFERENCE |
| Average Directional Index (ADX) | Strength of the trend momentum | 30.949 | Strong Trend |
| Relative Volatility Index (RVI) | Volatility over a specific period | 63.89 <50 = Low >50 = High | High Volatility |
Comparison of QTUM with BTC, ETH
Let us now compare the price movements of Qtum (QTUM) with that of Bitcoin (BTC), and Ethereum (ETH).
From the above chart, we can interpret that the price action of QTUM is similar to that of BTC and ETH. That is, when the price of BTC and ETH increases or decreases, the price of QTUM also increases or decreases respectively.
Qtum (QTUM) Price Prediction 2026, 2027 – 2030
With the help of the aforementioned technical analysis indicators and trend patterns, let us predict the price of Qtum (QTUM) between 2026, 2027, 2028, 2029 and 2030.
| Year | Bullish Price | Bearish Price |
| Qtum (QTUM) Price Prediction 2026 | $17 | $0.6 |
| Qtum (QTUM) Price Prediction 2027 | $18 | $0.5 |
| Qtum (QTUM) Price Prediction 2028 | $19 | $0.4 |
| Qtum (QTUM) Price Prediction 2029 | $20 | $0.3 |
| Qtum (QTUM) Price Prediction 2030 | $21 | $0.2 |
Conclusion
If Qtum (QTUM) establishes itself as a good investment in 2025, this year would be favorable to the cryptocurrency. In conclusion, the bullish Qtum (QTUM) price prediction for 2025 is $15.097. Comparatively, the bearish Qtum (QTUM) price prediction for 2025 is $0.781.
If there is a positive elevation in the market momentum and investors’ sentiment, then Qtum (QTUM) might hit $16. Furthermore, with future upgrades and advancements in the Qtum ecosystem, QTUM might surpass its current all-time high (ATH) of $106.88 and mark its new ATH.
FAQ
1. What is Qtum (QTUM)?
Qtum (QTUM) is the cryptocurrency of the hybrid blockchain project, Qtum. This project combines the best of Bitcoin and Ethereum blockchains to support smart contracts on the Ethereum Virtual Machine.
2. Where can you buy Qtum (QTUM)?
Traders can trade Qtum (QTUM) on the following cryptocurrency exchanges such as Binance, Huobi Global, HBTC and Hydax Exchange .
3. Will Qtum (QTUM) record a new ATH soon?
With the ongoing developments and upgrades within the Qtum platform, Qtum (QTUM) has a high possibility of reaching its ATH soon.
4. What is the current all-time high (ATH) of Qtum (QTUM)?
Qtum (QTUM) hit its current all-time high (ATH) of $106.88 (On Jan 07, 2018).
5. What is the lowest price of Qtum (QTUM)?
According to CoinMarketCap, QTUM hit its all-time low (ATL) of $0.77 on March 13, 2020.
6. Will Qtum (QTUM) hit $16?
If Qtum (QTUM) becomes one of the active cryptocurrencies that majorly maintain a bullish trend, it might rally to hit $16 soon.
7. What will be the Qtum (QTUM) price by 2026?
Qtum (QTUM) price might reach $17 by 2026.
8. What will be the Qtum (QTUM) price by 2027?
Qtum (QTUM) price might reach $18 by 2027.
9. What will be the Qtum (QTUM) price by 2028?
Qtum (QTUM) price might reach $19 by 2028.
10. What will be the Qtum (QTUM) price by 2029?
Qtum (QTUM) price might reach $20 by 2029.
Top Crypto Predictions
FTX Token (FTT) Price Prediction
Litecoin (LTC) Price Prediction
Disclaimer: The opinion expressed in this chart is solely the author’s. It does not represent any investment advice. TheNewsCrypto team encourages all to do their own research before investing.