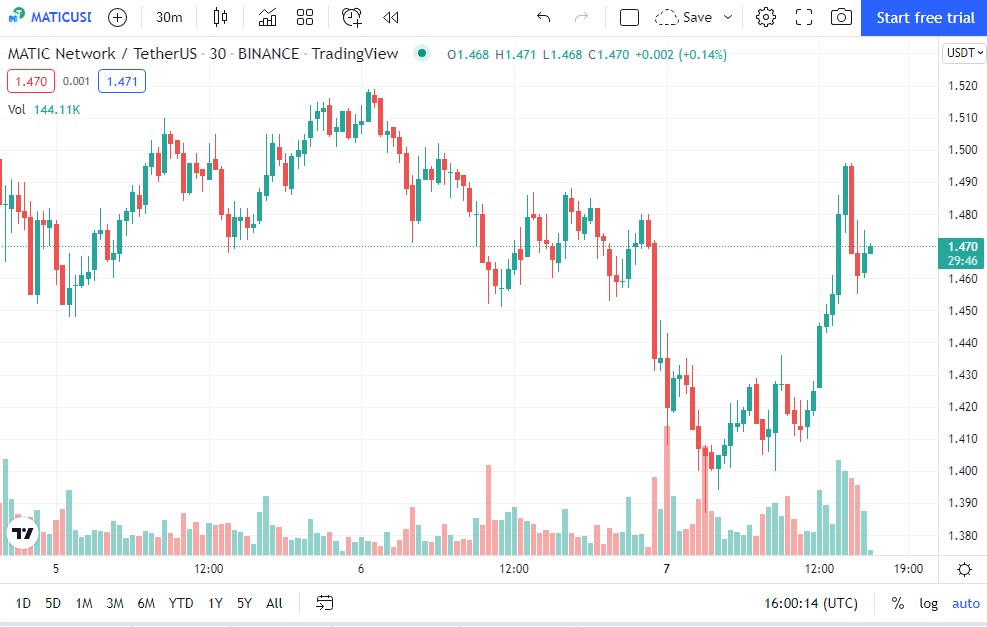
- The daily time frame chart of MATIC/USD shows a declining triangle pattern.
- If the MATIC price does not hold, the price will be dragged down to $1.2 support.
Polygon (MATIC) prices fluctuated in tandem with their fundamental values throughout the weekend. Since the start of trade, the negative trend has continued. Although the asset has turned the bears, a modest shift in the trend may be seen. If the price fails to break through the $1.5 level, there will be no substantial reversal in the trend until that happens. Technical indicators point to a small reversal of the negative trend, although there has been no official confirmation as of yet.
Bullish Divergence Emerged
MATIC traders have been employing the declining trendline to sell on rallies for the previous two months. Altcoin’s corrective rally dragged it down to the $0.1744 bottom support of $0.120. On the other hand, the RSI chart displays a bullish divergence on the daily, indicating a pattern breakout.

The daily time frame chart of MATIC/USD shows a declining triangle pattern. As a result of this bearish pattern, the pair’s value has dropped from a peak of $2.9 in December to only $1.47 today. After the latest rejection from the joint resistance of the 200-day EMA and declining trendline, the cryptocurrency fell by 13 percent and hit the $1.4 neckline. Shortly, there may be a breakthrough based on price activity towards the top of the pattern.
The price cannot re-enter the triangle, even though there has been a significant amount of purchasing activity. As a result, the bear might protest the current flip at any moment. As a result, if the MATIC price does not hold, the price will be dragged down to the lower support at $1.2 initially. According to CoinMarketCap, the Polygon price today is $1.47 USD with a 24-hour trading volume of $841,460,234 USD. Polygon is up 0.25% in the last 24 hours.


