- MATIC breaks out of descending trendline, signaling potential bullish momentum.
- Technical analysis suggests possible 50% surge to $0.75 if $0.48 level holds.
- On-chain data shows increased open interest and bullish sentiment among traders.
Polygon’s MATIC token has emerged as a beacon of hope in an otherwise tepid cryptocurrency market, captivating investors with a price surge and a decisive bullish breakout.
This remarkable performance stands in stark contrast to the struggles faced by market leaders Bitcoin (BTC) and Ethereum (ETH), positioning MATIC as a potential outlier in the current market cycle.
The bullish breakout for MATIC comes on the heels of a prolonged downtrend that persisted from March to August 2024. During this period, the token found itself constrained by a formidable descending trendline, which acted as a persistent barrier to upward movement.
However, recent price action, backed by substantial trading volume, has seen MATIC successfully breach this resistance, potentially signaling a shift in market sentiment.
MATIC’s analysis shows interesting picture
Technical analysis paints an intriguing picture for MATIC’s near-term prospects. Despite trading below the 200-day Exponential Moving Average (EMA) on the daily timeframe, experts suggest that the token’s outlook remains bullish.
The key to confirming this positive sentiment lies in MATIC’s ability to close a daily candle above the critical $0.48 level. Should this occur, analysts project the possibility of a staggering 50% rally, potentially propelling MATIC towards the $0.75 mark or beyond.
On-chain metrics further bolster the case for MATIC’s bullish outlook. Data from CoinGlass reveals a notable 19% increase in open interest over the past 24 hours, indicating growing engagement from both investors and traders.
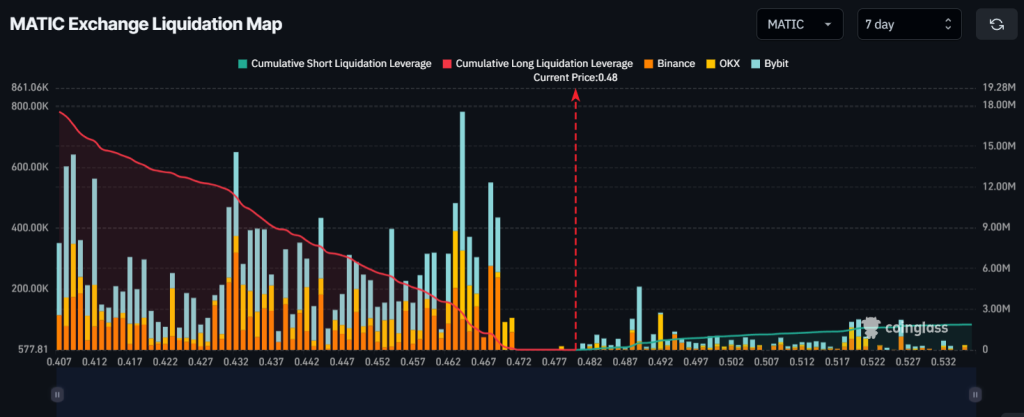
Moreover, the exchange liquidation map for the past week shows an imbalance, with long positions far outweighing shorts. This lopsided leverage distribution is often interpreted as a bullish signal, suggesting widespread optimism among market participants.
The current market structure presents two critical liquidation levels for MATIC: $0.464 on the downside and $0.489 on the upside. A breach of the upper threshold could trigger the liquidation of nearly half a million dollars worth of short positions, potentially fueling further upward momentum.
Conversely, a drop below the lower bound might result in the liquidation of $2.7 million in long positions, underscoring the delicate balance of market forces at play.