
- PI has climbed 9%, trading around $0.24.
- Its trading volume has jumped by over 300%.
As of November 20, the crypto market is witnessing mixed signals across the assets. Both red and green flags are waving, exhibiting indecisive price behaviour. For the last few days, the broader market has been lingering in extreme fear. With the BTC and ETH trading on the downside, PI bucks the trend with a sharp 9.84% jump against the market flow.
The asset opened the day trading at a bottom range of $0.2261, and eventually, as the bullish wave staged, it triggered the PI price to rise toward a high of $0.2609. Some of the crucial resistance zones between $0.2266 and $0.2604 have been tested and broken to confirm the uptrend.
If the bulls stay for a longer period, the price could see additional gains. Currently, PI traded within the $0.2488 level, with its market cap found at $2.06 billion. Concurrently, the daily trading volume of the asset has skyrocketed by over 300%, reaching the $65.33 million mark.
Can the PI Price Hold its Ground?
PI’s four-hour price chart shows the recovery mood, with its price climbing and targets a resistance at around $0.2498. An intensified upside pressure builds a highly bullish zone, likely inviting the golden cross to emerge, and taking the price up above the $0.2508 range.
On the downside, if the mighty bears make a comeback, the price of PI could retrace back to the $0.2478 support level. A deeper bearish correction might trigger the formation of the death cross and push the price down to its previous low at $0.2468 or even lower.
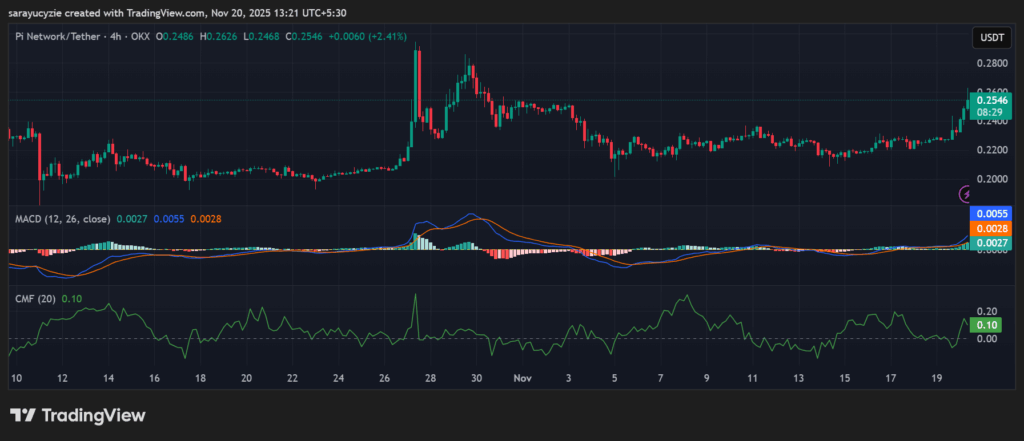
The Moving Average Convergence Divergence (MACD) line of PI has crossed above the signal line, which indicates that the bullish momentum is building. Also, the asset may be gearing up for a potential upward move. In addition, the asset’s Chaikin Money Flow (CMF) indicator at 0.10 suggests mild buying pressure in the market. The capital is flowing into the asset, showing mild accumulation, but not with strong conviction.
The asset’s daily Relative Strength Index (RSI) value of 81.52 implies a strong overbought condition. A value above 80 points out a very high buying, and a pullback or correction could occur. PI’s Bull Bear Power reading of 0.0296 signals a brief bullish pressure in the market. Notably, the active momentum is leaning bullish, but the strength is moderate.
Top Updated Crypto News