



- With a 5% gain, PI is trading at the $0.090 level.
- The daily trading volume has jumped by over 127%.
Pi Network is building momentum ahead of its Protocol 26 Mainnet upgrade, with node operators facing an August 11 deadline to prepare. The more immediate one is a new partnership: the Fabric Foundation has announced that Pi Network has joined RoboPay as a payment partner, giving PI token holders access to robotic services across the Fabric network.
The use cases come up with deliveries, inspections, security patrols, and humanoid assistance, all payable directly in PI. For a project with tens of millions of users already holding the token, adding a live payment utility is the kind of development that can shift narrative quickly.
On the other hand, looking at the price action, after falling 30%–40% or more in the short term, a 5%–10% bounce does not change the chart. A temporary rebound after a major drop is not a recovery until the chart confirms it, and until PI clears $0.10, the risk of this recovery losing momentum remains real.
At the time of writing, PI traded within the $0.09058 range, with a 5.84% spike in value. Concurrently, the asset’s daily trading volume has increased by over 127%, reaching $18.11 million.
Significant Price Levels of PI
Within the price trajectory of the asset, $0.10 is the line that matters most. A clean break and hold above it would restore buyer confidence and pull momentum traders back into the market. The primary bullish target would follow a successful breakout at around $0.11.
On the downside, a failure to hold the $0.10 level triggers the next supports into focus. The $0.08 threshold first, followed by $0.07 if the selling pressure of PI continues.
Will PI Momentum Stay Steady?
The Moving Average Convergence Divergence line is above the signal line, which shows that the short-term buying momentum is accelerating, triggering a strong buy signal. Also, the long-term trend is strongly bullish. PI is in a high-conviction markup phase, and the buyers are in full control across both short-term and long-term timeframes.
As long as the MACD line remains above the signal line and both stay above zero, the path of least resistance is up. If the lines get excessively stretched far above zero, it can signal the trend is getting overextended.
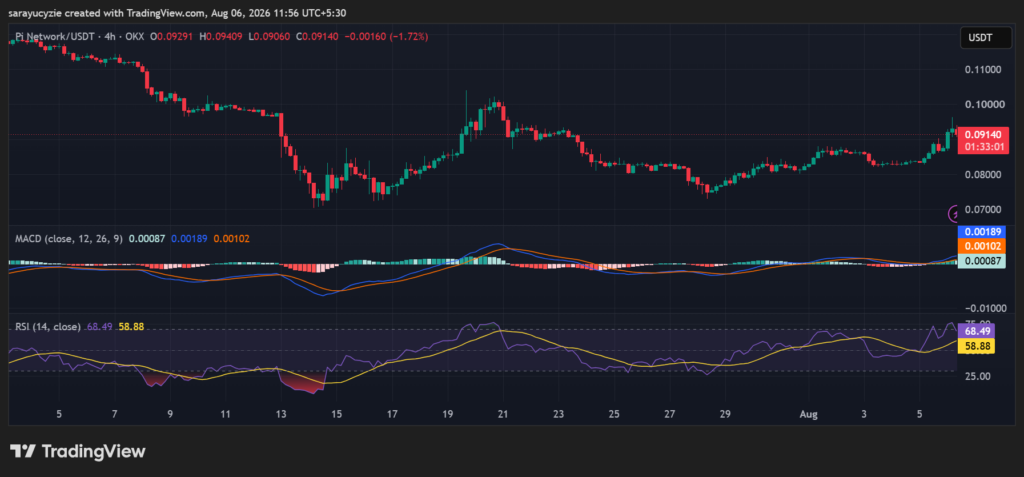
In addition, the daily Relative Strength Index (RSI) value of 68.49 displays strong bullish momentum, sitting on the doorstep of the overbought territory. As it is firmly above the 50 midline, the buying pressure is strong and driving a clear upward trend.
At this point, the rally has significant momentum, but PI is getting close to where price becomes stretched. The overall momentum is very healthy for bulls. While the trend remains strong, traders watch key resistance levels nearby for potential signs of consolidation as it approaches 70.
Crypto Market Highlights