
- PEPE surged 17.33% in the past 24 hours and recorded an intraday high of $0.000007408.
- Despite the rally, PEPE is still down 30% over the past month and 18.74% since March 2024.
Pepe (PEPE) is showing signs of recovery after hitting a multi-month low of $0.000005307 on March 11. Over the past 24 hours, the memecoin surged by 17.33%, reaching an intraday high of $0.000007408 before pulling back slightly. PEPE also gained 1% over the past week, but it remains down 30% in the 30-day and 18.74% since March 2024.
At present, PEPE is trading at $0.0000057005 with a market capitalization of $3 billion. The daily trading volume has also surged by 21.26%, surpassing $1.14 billion, as renewed investor interest drives buying pressure. This recovery comes in the memecoin as the global crypto market is bouncing back from its recent dip. Bitcoin (BTC), which briefly dropped below $80,000 earlier this week has now reclaimed the $83,000 level.
One of the key factors driving PEPE’s price surge and other leading altcoins could be the latest US inflation data. While inflation rose by 0.2% its pace has slowed, raising hopes for a potential interest rate cut by the Federal Reserve. This optimism has fueled increased activity in riskier assets like memecoins.
Adding to the bullish momentum, on-chain data from Lookonchain reveals that three major whales purchased nearly 690 billion PEPE tokens, investing around $4.3 million. This significant accumulation has helped push the price up by 15% from its recent bottom.
From a technical standpoint, PEPE has been in a downward trend over the medium to long term. Now the big question is—will it keep climbing, or is another pullback on the horizon?
PEPE’s Technical Outlook Shows Signs of Recovery
PEPE has been in a falling trend channel over the medium to long term, showing a weaker market trend. However, recent price action hints at a potential shift, with a bullish engulfing pattern forming on the weekly chart that signaling growing buying interest.
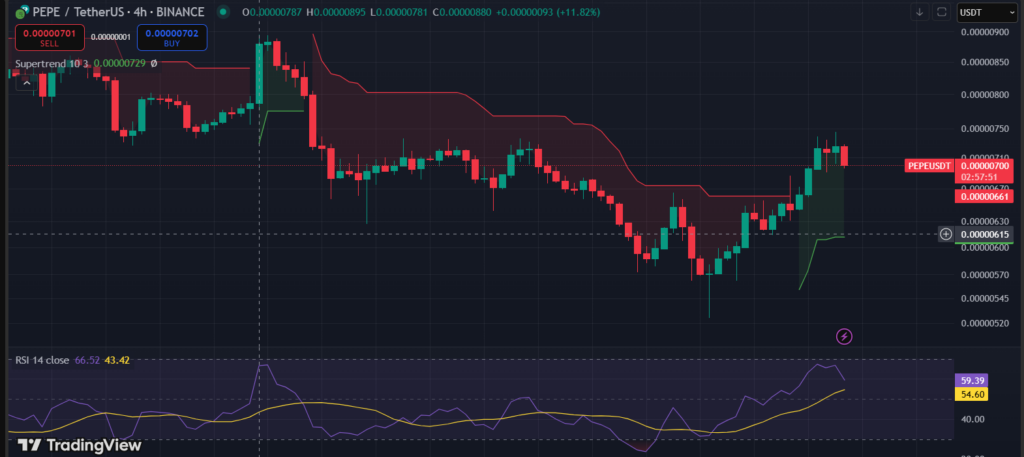
On the 4-hour PEPE/USDT chart, technical indicators suggest a slight bullish trend, with an RSI of 59 indicates neutral to slight bullish momentum which suggesting PEPE is not yet overbought but has room for further gains if buying pressure increases.
The MACD is above the signal line, indicating growing bullish momentum, while the Supertrend indicator has turned green, reinforcing a positive outlook.
If PEPE maintains its rally above $0.00000650, it could target $0.00000790, potentially triggering further gains toward $0.00000830 and $0.00000900. However, the weekly timeframe shows that PEPE broke below the $0.00000900 support level in early February, turning it into resistance. If bearish pressure resumes, memecoin could retest key support levels between $0.00000600 and $0.00000500, a historically strong demand zone.
Highlighted Crypto News