
- PENDLE trades at $3.32 with a 6% intraday drop, down significantly from the $7.00 peak in late 2024.
- RSI at 36.65 indicates oversold conditions while price trades below key 50-day and 200-day EMAs.
Pendle (PENDLE) is undergoing a major bearish pressure as indicated by various technical indicators that show that the altcoin has more downside potential. As per the CMC data, PENDLE is currently trading at $3.31 with an intraday drop of 6%. It has lost a lot of its value since its peak of approximately $7.00 in late 2024.
The moving average formation gives a worrying scenario to bulls. The 50-day exponential moving average at $3.8405 is dynamic resistance and is above the 200-day EMA at $3.7444. This formation shows a bearish pattern, and the price is now below the two major moving averages. All these EMAs are converging, which implies consolidation, but the entire structure is not favourable to a downward movement.
What’s Next For Pendle Price?
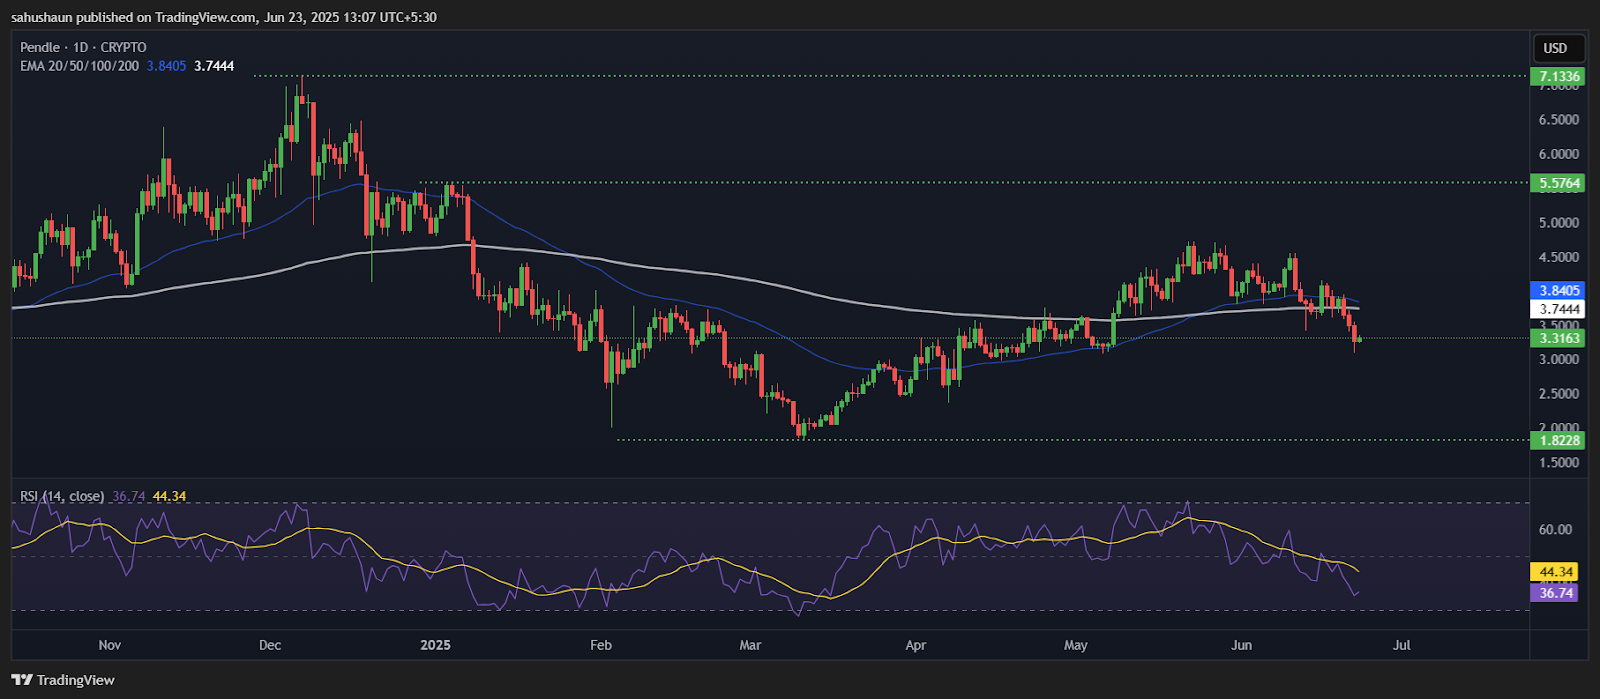
The Relative Strength Index (RSI) of 36.65 supports the bearish mood, and it is lower than its 14-period simple moving average of 44.34. This positioning is a sign that selling pressure is still in control, and the RSI is in an oversold area.
Although this may be an indication of a possible bounce, the momentum is still strongly bearish, and any relief rallies would most likely be received with selling pressure at higher prices.
In support and resistance terms, PENDLE has imminent resistance at $3.50, which is also the recent swing high. Another important resistance point is at $3.80, which is in tandem with the 50-day EMA. The levels are likely to limit any upward trends in the short run.
On the positive side, the critical support level of $3.00 is a psychological barrier for the bears. But if once breached, it may increase the selling pressure to the next major support of $2.50.
Pendle MACD indicator indicates further bearish divergence, and the histogram is still in the negative range. The social sentiment analysis shows a reading of -0.2527, which means that the market sentiment on PENDLE is largely negative, which is usually a precursor or accompaniment of price depreciation.
With the convergence of bearish technical signals, such as the moving average formation, RSI levels, and bearish sentiment levels, PENDLE seems to be on the downside.
The traders are advised to monitor the support at $3.00 because a breach may cause a deeper sell-off to the level of $2.50. Bounce efforts are likely to be met with stiff opposition at $3.50 and $3.80.
Highlighted Crypto News Today:
Ripple’s XRP Struggles to Hold Ground: Can It Rebound or Is a Deeper Correction Coming?