
- Optimism Token (OP) recorded an all-time low at $0.1271 on February 20.
- OP falls over 97% from its March 2024 high, and is trading nearly at $0.13.
Optimism Token (OP) has fallen more than 9% in the last 24 hours, now trading at nearly $0.13. With that, on February 20, it even hit an all-time low of $0.1271. This is a huge fall from its all-time high of $4.85 in March 2024, which is over 97% down.
According to the Coinglass derivatives data, Optimism traders faced $2.23 million in liquidation, with most of that coming from long positions, means who had bet the price would go up around $1.98 million in the last 24 hours. While the open interest data varies, which shows how many active trades are open, went up 25.34% in one day, showing the market is still very active.
With that, on February 18, Layer 2 chain, Base introduced a single unified stack called for accelerating upgrades and additional security, and it was planned to make public and open for contribution, as it is moving away from the OP Stack, but it assures that it would remain compatible with OP Stack standards.
As this shift from Base, which indicates a fundamental weakening of the Optimism’s Superchain vision, which is a grand idea to unite multiple Layer-2 chains under shared governance, shared security, unified governnace and revenue-sharing agreements.
OP Price Analysis
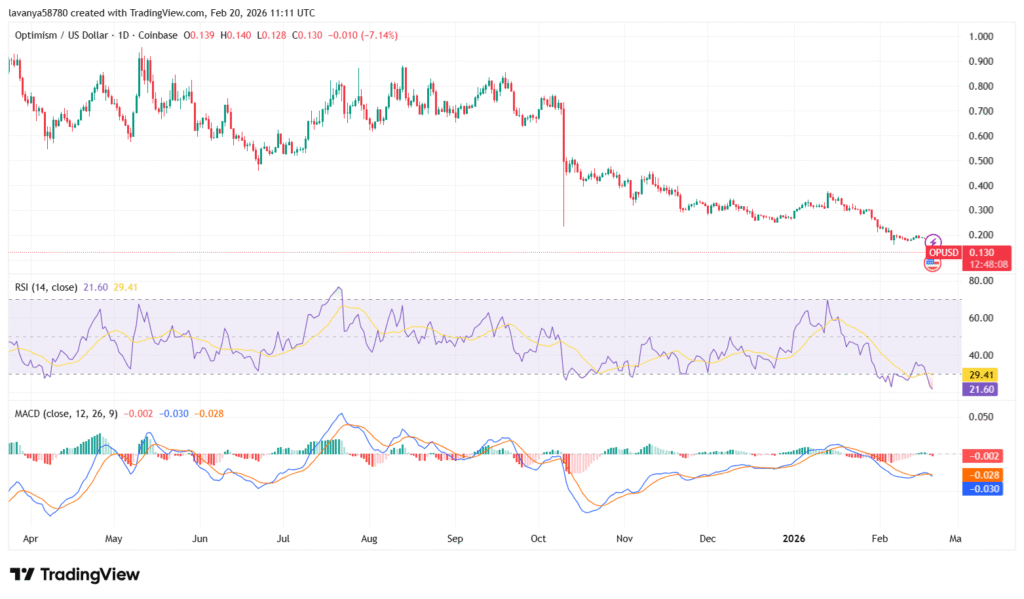
Optimism Token (OP) continues to trade near $0.13, after previously reaching around $1.40. The 24-hour trading volume has risen by approximately 7.79%, standing at $224.19 million, showing continued market activity despite the token’s decline.
With that, the immediate support for OP token lies at $0.125; if it breaks below, the OP token could fall deeper toward $0.110 – $0.100. On the reversal, the immediate resistance is seen at $0. 14, when the token breaks above this, the token could touch $0.16.
Analyzing through technical indicators, RSI is standing around the 21-29 range, which is a deeply oversold condition, which shows a chance for a short-term bounce, but if a token shows strong downtrends, it could stay below for longer periods, too. Also, the OP’s Moving Average Convergence and Divergence line is below zero, which indicates a clear bearish signal.
Highlighted Crypto News: