


- Bullish OKB price prediction for 2025 is $61.73 to $87.00.
- OKB (OKB) price might reach $100 soon.
- Bearish OKB price prediction for 2025 is $33.22.
In this OKB (OKB) price prediction for 2025, 2026-2030, we will analyze the price patterns of OKB by using accurate trader-friendly technical analysis indicators and predict the future movement of the cryptocurrency.
TABLE OF CONTENTS |
INTRODUCTION |
|
OKB (OKB) PRICE PREDICTION 2025 |
|
| OKB (OKB) PRICE PREDICTION 2026, 2027-2030 |
| CONCLUSION |
| FAQ |
OKB (OKB) Current Market Status
| Current Price | $50.88 | 24 – Hour Price Change | 0.91% Down |
| 24 – Hour Trading Volume | $7.81M |
| Market Cap | $3.05B |
| Circulating Supply | 60M OKB/td> | All – Time High | $73.83 (On Mar 14, 2024) |
| All – Time Low | $1.25 (On May 17, 2019) |
What is OKB (OKB)
| TICKER | OKB |
| BLOCKCHAIN | OKExChain |
| CATEGORY | OKEx Utility Token |
| LAUNCHED ON | March, 2018 |
| UTILITIES | Governance, trading fees & rewards |
OKB (OKB) is the native cryptocurrency of the OKX crypto exchange. The Malta-based exchange, OKX separated from the China-based OKCoin exchange platform and became independent in 2017. OKCoin exchange aids fiat-crypto trading whereas OKX supports cryptocurrency and derivatives trading.
Its native exchange token, OKB, was launched as an ERC-20 token in 2018. OKB primarily serves as the trading fee within the platform. Users gain voting rights by holding the OKB tokens. OKB also provides discounts to the exchange users and is also offered to users as rewards.
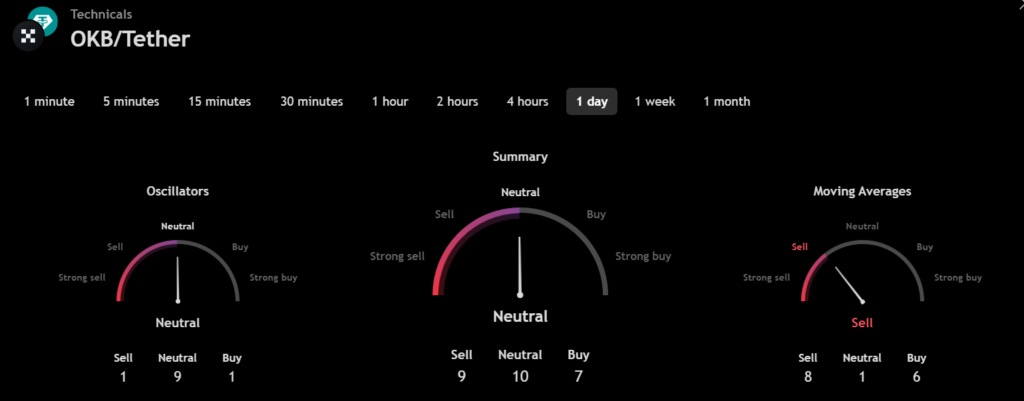
OKB 24H Technicals
OKB (OKB) Price Prediction 2025
OKB (OKB) ranks 32nd on CoinMarketCap in terms of its market capitalization. The overview of the OKB price prediction for 2025 is explained below with a daily time frame.
In the above chart, OKB (OKB)) laid out a Horizontal channel pattern. The Horizontal channel pattern is also known as the sideways trend. In general, the horizontal channel is formed during the price consolidation. In this pattern, the upper trendline, the line which connects the highs, and the lower trendline, the line which connects the lows, run horizontally parallel, and the price action is contained within it.
A horizontal channel is often regarded as one of the suitable patterns for timing the market as the buying and selling points are in consolidation.
At the time of analysis, OKB (OKB) was recorded at $49.79. If the pattern trend continues, then the price of OKB might reach the resistance levels of $61.32 and $96.59. If the trend reverses, then the price of OKB may fall to the support levels of $48.71 (already crossed) and $38.85.
OKB (OKB) Resistance and Support Levels
The chart given below elucidates the possible resistance and support levels of OKB (OKB) in 2025.
From the above chart, we can analyze and identify the following as resistance and support levels of OKB (OKB) for 2025.
| Resistance Level 1 | $61.73 |
| Resistance Level 2 | $87.00 |
| Support Level 1 | $44.89 |
| Support Level 2 | $33.22 |
OKB (OKB) Price Prediction 2025 — RVOL, MA, and RSI
The technical analysis indicators such as Relative Volume (RVOL), Moving Average (MA), and Relative Strength Index (RSI) of OKB (OKB) are shown in the chart below.
From the readings on the chart above, we can make the following inferences regarding the current OKB (OKB) market in 2025.
| INDICATOR | PURPOSE | READING | INFERENCE |
| 50-Day Moving Average (50MA) | Nature of the current trend by comparing the average price over 50 days | 50 MA = $52.10 Price = $49.81 (50MA > Price) | Bearish/Downtrend |
| Relative Strength Index (RSI) | Magnitude of price change;Analyzing oversold & overbought conditions | 32.86 <30 = Oversold 50-70 = Neutral >70 = Overbought | Oversold |
| Relative Volume (RVOL) | Asset’s trading volume in relation to its recent average volumes | Below cutoff line | Weak volume |
OKB (OKB) Price Prediction 2025 — ADX, RVI
In the below chart, we analyze the strength and volatility of OKB (OKB) using the following technical analysis indicators — Average Directional Index (ADX) and Relative Volatility Index (RVI).
From the readings on the chart above, we can make the following inferences regarding the price momentum of OKB (OKB).
| INDICATOR | PURPOSE | READING | INFERENCE |
| Average Directional Index (ADX) | Strength of the trend momentum | 15.62 | Weak Trend |
| Relative Volatility Index (RVI) | Volatility over a specific period | 40.41 <50 = Low >50 = High | Low volatility |
Comparison of OKB with BTC, ETH
Let us now compare the price movements of OKB (OKB) with that of Bitcoin (BTC), and Ethereum (ETH).
From the above chart, we can interpret that the price action of OKB is similar to that of BTC and ETH. That is, when the price of BTC and ETH increases or decreases, the price of OKB also increases or decreases respectively.
OKB (OKB) Price Prediction 2026, 2027 – 2030
With the help of the aforementioned technical analysis indicators and trend patterns, let us predict the price of OKB (OKB) in 2026, 2027, 2028, 2029, and 2030.
| Year | Bullish Price | Bearish Price |
| OKB (OKB) Price Prediction 2026 | $165 | $32 |
| OKB (OKB) Price Prediction 2027 | $170 | $46 |
| OKB (OKB) Price Prediction 2028 | $180 | $34 |
| OKB (OKB) Price Prediction 2029 | $190 | $52 |
| OKB (OKB) Price Prediction 2030 | $200 | $60 |
Conclusion
If OKB (OKB) establishes itself as a good investment in 2025, this year would be favorable to the cryptocurrency. In conclusion, the bullish OKB (OKB) price prediction for 2025 is $87.00. Comparatively, if unfavorable sentiment is triggered, the bearish OKB (OKB) price prediction for 2025 is $33.22.
If the market momentum and investors’ sentiment positively elevates, then OKB (OKB) might hit $100. Furthermore, with future upgrades and advancements in the OKB ecosystem, OKB might surpass its current all-time high (ATH) of $73.83 and mark its new ATH.
FAQ
1. What is OKB (OKB)?
OKB is the native cryptocurrency of the OKX crypto exchange, providing utility for trading fees, voting rights, discounts, and rewards within the platform.
2. Where can you buy OKB (OKB)?
Traders can trade OKB (OKB) on the following cryptocurrency exchanges such as GroveX, OKX, BingX, Bitrue, and Tapbit.
3. Will OKB (OKB) record a new ATH soon?
With the ongoing developments and upgrades within the OKB platform, OKB has a high possibility of reaching its ATH soon.
4. What is the current all-time high (ATH) of OKB (OKB)?
OKB (OKB) hit its current all-time high (ATH) of $73.83 on March 14, 2024.
5. What is the lowest price of OKB (OKB)?
According to CoinMarketCap, OKB hit its all-time low (ATL) of $1.25 on May 17, 2019.
6. Will OKB (OKB) hit $100?
If OKB (OKB) becomes one of the active cryptocurrencies that maintains a bullish trend, it might rally to hit $100 soon.
7. What will be the OKB (OKB) price by 2026?
OKB (OKB) price might reach $165 by 2026.
8. What will be the OKB (OKB) price by 2027?
OKB (OKB) price might reach $170 by 2027.
9. What will be the OKB (OKB) price by 2028?
OKB (OKB) price might reach $180 by 2028.
10. What will be the OKB (OKB) price by 2029?
OKB (OKB) price might reach $190 by 2029.
Top Crypto Predictions
Avalanche (AVAX) Price Prediction
Bitget Token (BGB) Price Prediction
Disclaimer: The opinion expressed in this article is solely the author’s. It does not represent any investment advice. TheNewsCrypto team encourages all to do their own research before investing.