
- OFFICIAL TRUMP is hovering at the $3 level.
- TRUMP’s trading volume has dropped by 13%.
The red colour is painted across the crypto charts, displaying remarkable losses. With the fear sentiment hanging in the air, the price movements have nosedived. The largest asset, Bitcoin (BTC), has fallen to $68K, and Ethereum (ETH), the largest altcoin, trades at $1.9K. Meanwhile, the OFFICIAL TRUMP (TRUMP) has registered a 3.64% drop in price.
TRUMP kick-started the day at around $3.19, and with the bearish pressure in the market, the price slipped to a low of $3.05. Only a steady breakout could help the asset recover. At the same time, a further drop in value may see deeper losses.
The CoinMarketCap data has reported that at press time, OFFICIAL TRUMP traded within the $3.05 zone. With its market cap reaching $709.89 million, the daily trading volume of TRUMP has decreased by 13.95%, touching the $94.16 million mark.
As the OFFICIAL TRUMP market is taken by bears, red candlesticks are lit up, and the price might retrace to the nearby support range at $2.92. If the loss strengthens, the death cross will unfold, gradually sending the price even lower. Assuming the OFFICIAL TRUMP price chart turned green, the bulls could take the price up to the resistance at the $3.20 level. More traction on the upside may initiate the golden cross to emerge, and push the token toward its recent high.
What is Next for OFFICIAL TRUMP Price: Rally Ahead or Pullback?
The OFFICIAL TRUMP’s Moving Average Convergence Divergence (MACD) line and the signal lines are found below the zero line, indicating its bearish momentum phase. The recent price action is weaker than the broader trend. It may remain weak until the lines start moving back to zero.
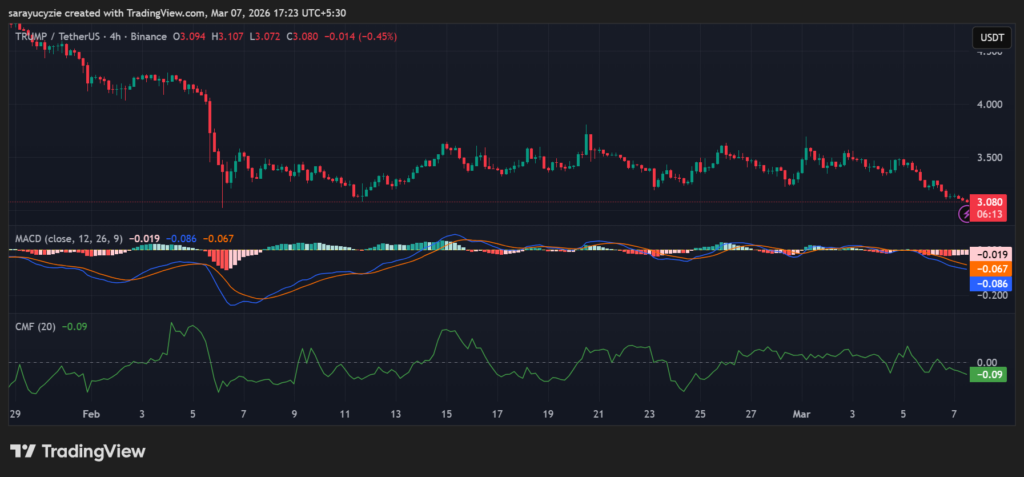
In addition, the Chaikin Money Flow (CMF) indicator of TRUMP at -0.09 suggests moderate selling pressure, with more capital flowing out of the asset. This negative value displays distribution and gives a cautious market sentiment. If it moves further below, bearish pressure could strengthen.
TRUMP’s daily Relative Strength Index (RSI) at 26.71 implies the oversold condition. The selling pressure has been very strong, pushing the price down. This level may lead to a short-term relief rally, but it does not hint at a trend reversal. Furthermore, the Bull Bear Power (BBP) reading of OFFICIAL TRUMP at -0.195 signals moderate bearish dominance. It reflects selling activity and weak buying support. A deeper move into the negative territory makes the downtrend stronger.
Top Updated Crypto News
Bitcoin (BTC) Price Battle: Will Bears Push It to $60K or Can Bulls Reclaim $70K?