
- Bullish MELANIA price prediction for 2025 is $0.982 to $1.622.
- Official Melania Meme (MELANIA) price might reach $5 soon.
- Bearish MELANIA price prediction for 2025 is $0.377.
In this Official Melania Meme (MELANIA) price prediction 2025, 2026-2030, we will analyze the price patterns of MELANIA by using accurate trader-friendly technical analysis indicators and predict the future movement of the cryptocurrency.
TABLE OF CONTENTS |
INTRODUCTION |
|
OFFICIAL MELANIA MEME PRICE PREDICTION 2025 |
|
| OFFICIAL MELANIA MEME PRICE PREDICTION 2026, 2027-2030 |
| CONCLUSION |
| FAQ |
Official Melania Meme (MELANIA) Current Market Status
| Current Price | $0.6869 | 24 – Hour Price Change | 3.51% Up |
| 24 – Hour Trading Volume | $35.89M |
| Market Cap | $369.09M |
| Circulating Supply | 537.31M MELANIA | All – Time High | $13.73 (On Jan 20, 2025) |
| All – Time Low | $0.6532 (On Mar 17, 2025) |
What is Official Melania Meme (MELANIA)
| TICKER | MELANIA |
| BLOCKCHAIN | Solana |
| CATEGORY | Meme Coin |
| LAUNCHED ON | January 2025 |
| UTILITIES | Speculation, Collectible, Engagement, Influence, and Fundraising |
Melania Trump launched the Official Melania Meme (MELANIA) in January 2025, joining the growing trend of political meme coins. This move followed the success of Donald Trump’s TRUMP token, which had gained significant traction in the crypto community. Meme coins are typically driven by online hype and social media trends rather than fundamental utility, making them highly speculative investments.
The launch of MELANIA led to fluctuations in the market, impacting the price movements of related tokens. While supporters see it as a strategic entry into the digital asset space, critics raise concerns about potential ethical and financial implications, especially given Trump’s political influence.
Experts caution that, like most meme coins, $MELANIA is subject to extreme volatility. While it has garnered strong interest from traders and speculators, its long-term viability remains uncertain, largely dependent on continued market enthusiasm and online engagement.
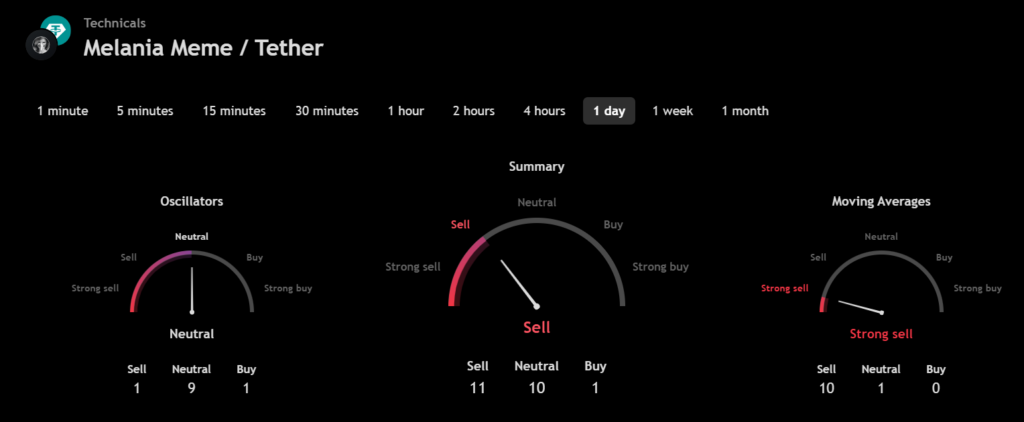
Official Melania Meme 24H Technicals
Official Melania Meme (MELANIA) Price Prediction 2025
Official Melania Meme (MELANIA) ranks 126th on CoinMarketCap in terms of its market capitalization. The overview of the Official Melania Meme price prediction for 2025 is explained below with a daily time frame.
In the above chart, Official Melania Meme (MELANIA) laid out the Horizontal Channel pattern also known as the sideways trend. In general, the horizontal channel is formed during the price consolidation. In this pattern, the upper trendline, the line which connects the highs, and the lower trendline, the line which connects the lows, run horizontally parallel and the price action is contained within it.
A horizontal channel is often regarded as one of the suitable patterns for timing the market as the buying and selling points are in consolidation.
At the time of analysis, the price of the Official Melania Meme (MELANIA) was recorded at $0.678. If the pattern trend continues, then the price of MELANIA might reach the resistance levels of $0.702, $0.778 and $0.955. If the trend reverses, then the price of MELANIA may fall to the support levels of $0.635.
Official Melania Meme (MELANIA) Resistance and Support Levels
The chart given below elucidates the possible resistance and support levels of Official Melania Meme (MELANIA) in 2025.
From the above chart, we can analyze and identify the following as resistance and support levels of Official Melania Meme (MELANIA) for 2025.
| Resistance Level 1 | $0.982 |
| Resistance Level 2 | $1.622 |
| Support Level 1 | $0.639 |
| Support Level 2 | $0.377 |
Official Melania Meme (MELANIA) Price Prediction 2025 — RVOL, MA, and RSI
The technical analysis indicators such as Relative Volume (RVOL), Moving Average (MA), and Relative Strength Index (RSI) of Official Melania Meme (MELANIA) are shown in the chart below.
From the readings on the chart above, we can make the following inferences regarding the current Official Melania Meme (MELANIA) market in 2025.
| INDICATOR | PURPOSE | READING | INFERENCE |
| 50-Day Moving Average (50MA) | Nature of the current trend by comparing the average price over 50 days | 50 MA = $0.708 Price = $0.678 (50MA > Price) | Bearish/Downtrend |
| Relative Strength Index (RSI) | Magnitude of price change;Analyzing oversold & overbought conditions | 46.820 <30 = Oversold 50-70 = Neutral >70 = Overbought | Nearly Oversold |
| Relative Volume (RVOL) | Asset’s trading volume in relation to its recent average volumes | Below cutoff line | Weak volume |
Official Melania Meme (MELANIA) Price Prediction 2025 — ADX, RVI
In the below chart, we analyze the strength and volatility of Official Melania Meme (MELANIA) using the following technical analysis indicators — Average Directional Index (ADX) and Relative Volatility Index (RVI).
From the readings on the chart above, we can make the following inferences regarding the price momentum of Official Melania Meme (MELANIA).
| INDICATOR | PURPOSE | READING | INFERENCE |
| Average Directional Index (ADX) | Strength of the trend momentum | 68.096 | Very Strong Trend |
| Relative Volatility Index (RVI) | Volatility over a specific period | 38.98 <50 = Low >50 = High | Low volatility |
Comparison of MELANIA with BTC, ETH
Let us now compare the price movements of Official Melania Meme (MELANIA) with that of Bitcoin (BTC), and Ethereum (ETH).
From the above chart, we can interpret that the price action of MELANIA is similar to that of BTC and ETH. That is, when the price of BTC and ETH increases or decreases, the price of MELANIA also increases or decreases respectively.
Official Melania Meme (MELANIA) Price Prediction 2026, 2027 – 2030
With the help of the aforementioned technical analysis indicators and trend patterns, let us predict the price of Official Melania Meme (MELANIA) between 2026, 2027, 2028, 2029, and 2030.
| Year | Bullish Price | Bearish Price |
| Official Melania Meme (MELANIA) Price Prediction 2026 | $5.5 | $0.5 |
| Official Melania Meme (MELANIA) Price Prediction 2027 | $6 | $0.4 |
| Official Melania Meme (MELANIA) Price Prediction 2028 | $6.5 | $0.3 |
| Official Melania Meme (MELANIA) Price Prediction 2029 | $7 | $0.2 |
| Official Melania Meme (MELANIA) Price Prediction 2030 | $7.5 | $0.1 |
Conclusion
If Official Melania Meme (MELANIA) establishes itself as a good investment in 2025, this year would be favorable to the cryptocurrency. In conclusion, the bullish Official Melania Meme (MELANIA) price prediction for 2025 is $1.622. Comparatively, if unfavorable sentiment is triggered, the bearish Official Melania Meme (MELANIA) price prediction for 2025 is $0.377.
If the market momentum and investors’ sentiment positively elevate, then Official Melania Meme (MELANIA) might hit $5. Furthermore, with future upgrades and advancements in the Official Melania Meme ecosystem, MELANIA might surpass its current all-time high (ATH) of $13.73 and mark its new ATH.
FAQ
1. What is Official Melania Meme (MELANIA)?
Melania Trump launched the Official Melania Meme (MELANIA) in January 2025, joining the growing trend of political meme coins.
2. Where can you purchase Official Melania Meme (MELANIA)?
Official Melania Meme (MELANIA) has been listed on many crypto exchanges which include DigiFinex, gate.io, bitget, Kraken, kuCoin, MEXC, XT.com, bitunix, OrangeX, HTX, Meteora, Raydium.
3. Will Official Melania Meme (MELANIA) reach a new ATH soon?
With the ongoing developments and upgrades within the Official Melania Meme Platform, MELANIA has a high possibility of reaching its ATH soon.
4. What is the current all-time high (ATH) of Official Melania Meme (MELANIA)?
On Jan 20, 2025, Official Melania Meme (MELANIA) reached its new all-time high (ATH) of $13.73.
5. What is the lowest price of Official Melania Meme (MELANIA)?
According to CoinMarketCap, MELANIA hit its all-time low (ATL) of $1.35, On Feb 03, 2025.
6. Will Official Melania Meme (MELANIA) reach $5?
If Official Melania Meme (MELANIA) becomes one of the active cryptocurrencies that majorly maintain a bullish trend, it might rally to hit $5 soon.
7. What will be Official Melania Meme (MELANIA) price by 2026?
Official Melania Meme (MELANIA) price is expected to reach $5.5 by 2026.
8. What will be Official Melania Meme (MELANIA) price by 2027?
Official Melania Meme (MELANIA) price is expected to reach $6 by 2027.
9. What will be Official Melania Meme (MELANIA) price by 2028?
Official Melania Meme (MELANIA) price is expected to reach $6.5 by 2028.
10. What will be Official Melania Meme (MELANIA) price by 2029?
Official Melania Meme (MELANIA) price is expected to reach $7 by 2029.
Top Crypto Predictions
Algorand (ALGO) Price Prediction
Disclaimer: The opinion expressed in this article is solely the author’s. It does not represent any investment advice. TheNewsCrypto team encourages all to do their own research before investing.