
- Memecoin MOG Coin rose to its 2-month high but failed to retest the key resistance.
- The memecoin market surged 13% to hit $59.31 billion.
The October cycle was indeed a not-so-bearish phase for the meme players. Notably, the current cap of the overall memecoin market jumped 13% from $52.48 billion to form this 4-month peak at $59.31 billion. This upswing was revived following the recent listings of emerging memecoins on Binance, the largest crypto exchange.
Multiple memecoins recorded bullish rallies spurred by news of their Binance listings. In contrast, despite MOG being traded on prominent CEXs, its community feels let down that MOG Coin isn’t listed on Binance yet.

Let’s analyze how this cat-themed memecoin is currently performing and predict its potential trajectory in the market.
Analysis of MOG Coin’s 24H Price Outlook
Over the last 24 hours, MOG Coin recorded a decline of 2.77%, hitting a low of $0.000001656. Amid this decline, the memecoin’s daily trading volume noted a surge of 50.72%.
The 4-hour price chart of MOG reflects bearish patterns through its key indicators. Currently, the price of the cat-themed memecoin hovers below two moving averages (MA), the 9-day MA [$0.000001749] and the 21-day MA [$0.000001787]. Moreover, the following chart shows a bearish crossover, where the 9MA dips below the 21MA.
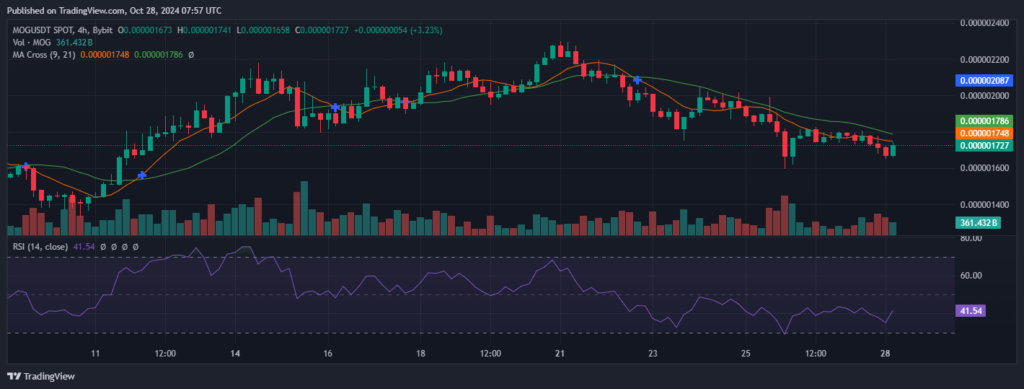
Meanwhile, MOG is closer to the oversold zone, with its relative strength index (RSI) at 42.17. At the time of analysis, MOG Coin (MOG) traded at $0.000001728 with a market cap of $674.52 million.
MOG Coin Price Prediction 2024
The cat-themed memecoin recorded a 4854% surge over the past year — from $0.00000004632 to $0.000002295. In 2024, MOG reached two notable price peaks — $0.000002487 and $0.000002300.
Looking at the following price chart, you can see the formation of a rounding bottom pattern as price action had a curved, bottoming structure from July through early October. Significantly, MOG signaled a potential bullish trend after laying a breakout in mid-October.
However, the rounding bottom’s breakout turned out to be a false breakout, as the price failed to retest the resistance. Later, it began falling back into the bottoming range.
If the bearish cues gain the upper hand, MOG Coin might plunge to two critical support levels $0.000001250 and $0.000000951. Further negative sentiment could push the memecoin to the September bottom — $0.000000695.
On the flip side, if the memecoin experiences a bullish price correction, it might rally and test key resistances such as $0.000001999 and $0.000002206. Also, a strengthened upward momentum could push MOG to claim a new all-time high (ATH) at $0.000002541.
Disclaimer: The opinion expressed in this article is solely the author’s. It does not represent any investment or financial advice. TheNewsCrypto team encourages all readers to do their own research before investing.