- MemeCore is trading within a descending consolidation range below major moving averages.
- Technical indicators show bearish momentum, with support near $1.20 and resistance between $1.55 and $1.69.
MemeCore (M) is trading over 7% higher on Tuesday, extending Monday’s 10% rebound following a sharp 28% sell-off on Sunday. The recent recovery marks a more stable start to the week after aggressive downside pressure pushed the meme coin toward early-February lows.
Today’s gains come as the global crypto market remains under pressure. The relative outperformance appears driven primarily by short-term technical factors, including dip-buying near established support levels and reduced selling momentum following Sunday’s sharp decline.
No Clear Trend Direction at Present
Despite short-term recovery earlier in the week, MemeCore is moving within a descending consolidation range on the daily chart. The meme coin price has formed a sequence of lower highs while holding above short-term support, indicating compression rather than trend continuation. The rejection near the $1.90 area earlier in the month led to the long-term downward bias, while recent candles suggest hesitation among sellers near current levels.
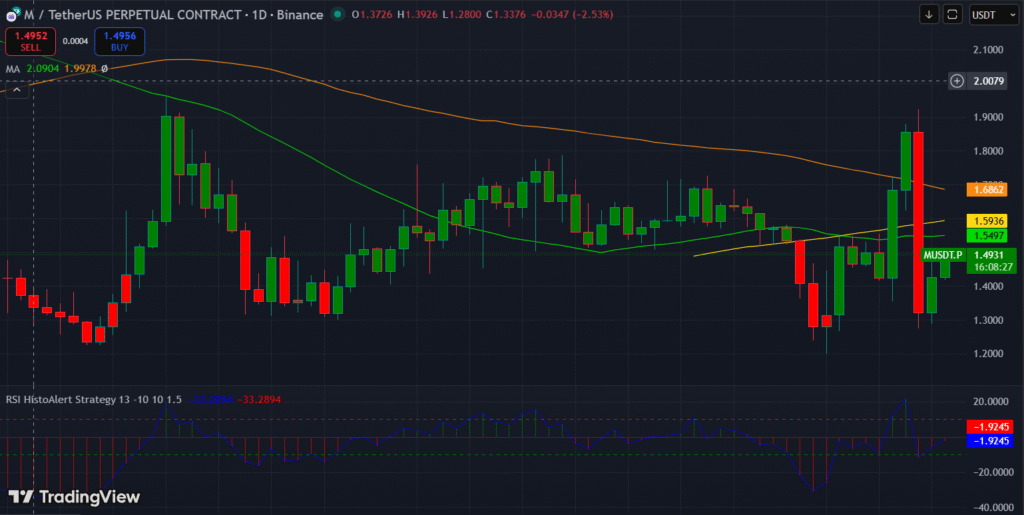
As well, MemeCore remains below all major moving averages, keeping the broader structure bearish. The 200-day Moving Average is positioned near $1.6862 and continues to cap upside attempts. Below it, the 100-day MA stands at $1.5936, while the 50-day MA is located around $1.5497. This creates a layered resistance zone between $1.55 and $1.69, which price has failed to reclaim.
Zooming in, the RSI histogram is currently near -33.29, indicating bearish momentum and suggesting that selling pressure is still dominant. This implies the market is closer to oversold conditions rather than balanced buying and selling. Meanwhile, the Moving Average Convergence Divergence (MACD) indicator shows the MACD line and signal line moving closer together, reflecting waning bearish momentum but without a confirmed bullish crossover.
Still, MemeCore is trying to stabilize after the recent drop. The $1.20 level, which was also the low on February 1, is an important support point. If the price falls below this level, it could lead to further declines. On the other hand, if buying pressure increases, the price may face resistance near the 200-day moving average, and then near the 50-day moving average.
Overall, MemeCore’s price movement shows signs of recovery within a period of sideways trading. More clear price movement is needed before a strong trend can be confirmed.
Highlighted Crypto News Today:
Fed Governor Stephen Miran Backs Weaker Dollar and Tariff Policies While Crypto Prices Stay Stagnant