
- Bullish MANTA price prediction for 2025 is $0.863 to $1.197.
- Manta Network (MANTA) price might reach $5 Soon.
- Bearish (MANTA) price prediction for 2025 is $0.427.
In this Manta Network (MANTA) price prediction 2025, 2026-2030, we will analyze the price patterns of MANTA by using accurate trader-friendly technical analysis indicators and predict the future movement of the cryptocurrency.
TABLE OF CONTENTS |
INTRODUCTION |
|
MANTA NETWORK (MANTA) PRICE PREDICTION 2025 |
|
| MANTA NETWORK (MANTA) PRICE PREDICTION 2026, 2027-2030 |
| CONCLUSION |
| FAQ |
Manta Network (MANTA) Current Market Status
| Current Price | $0.1232 | 24 – Hour Price Change | 4.41% Up |
| 24 – Hour Trading Volume | $28.94M |
| Market Cap | $28.94M |
| Circulating Supply | 449.86M MANTA | All – Time High | $4.08 ( On March 13, 2024) |
| All – Time Low | $0.05367 (On Oct 11, 2025) |
What is Manta Network (MANTA)
| TICKER | MANTA |
| BLOCKCHAIN | Polkadot |
| CATEGORY | Decentralized project |
| LAUNCHED ON | January 2024 |
| UTILITIES | Governance, security, gas fees & rewards |
Manta Network stands as a comprehensive ecosystem for zero-knowledge (ZK) applications, offering two distinct networks – Manta Pacific and Manta Atlantic. Manta Pacific, an L2 ecosystem on Ethereum, provides an efficient gas-fee environment for ZK applications, while Manta Atlantic, on Polkadot, serves as the fastest ZK L1 chain, introducing programmable identities and credentials. Developed by a seasoned team with backgrounds from prestigious institutions, Manta Network has garnered investments from prominent web3 funds like Binance Labs and Polychain Capital. Manta Pacific and Manta Atlantic collectively usher in the next era of web3 application development, emphasizing the practical application of zero-knowledge cryptography.
The MANTA utility on Manta Pacific and Manta Atlantic fuels on-chain activities, incentivizes builders and contributors, benefits token holders, and fosters a thriving ecosystem through revenue generation and distribution. $MANTA serves as a medium of exchange, facilitates governance rights, and ensures network security, with allocations dedicated to incentivizing active participants through airdrops.
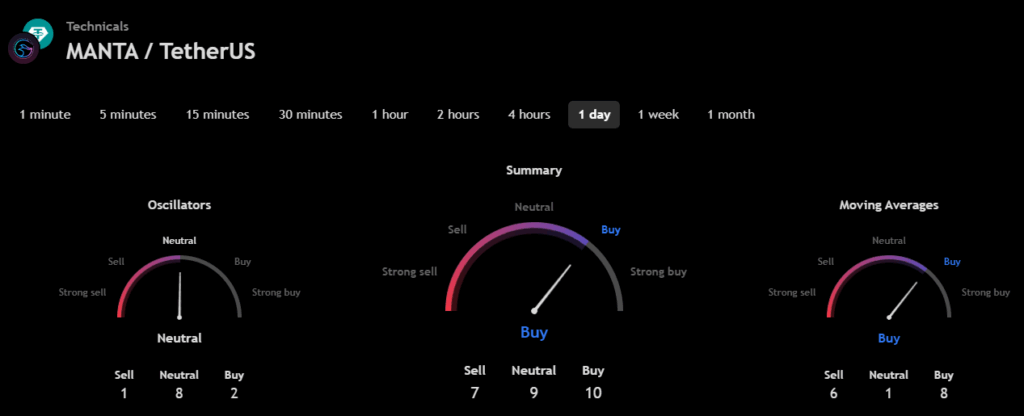
Manta Network 24H Technicals
Manta Network (MANTA) Price Prediction 2025
Manta Network (MANTA) ranks 445th on CoinMarketCap in terms of its market capitalization. The overview of the Manta Network price prediction for 2025 is explained below with a daily time frame.
MANTA/USDT Horizontal Channel Pattern (Source: TradingView)
In the above chart, Manta Network (MANTA) laid out a horizontal channel also known as the sideways trend. In general, the horizontal channel is formed during the price consolidation. In this pattern, the upper trendline, the line that connects the highs, and the lower trendline, the line that connects the lows, run horizontally parallel and the price action is contained within it.
If the trend breaks out at the resistance level, the price will continue to move up in this ascending triangle pattern.
At the time of analysis, the price of Manta Network (MANTA) was recorded at $0.1232. If the pattern trend continues, then the price of MANTA might reach the resistance level of $0.802, and $1.062. If the trend reverses, then the price of MANTA may fall to the support of $0.693, and $0.601.
Manta Network (MANTA) Resistance and Support Levels
The chart given below elucidates the possible resistance and support levels of Manta Network (MANTA) in 2025.
MANTA/USDT Resistance and Support Levels (Source: TradingView)
From the above chart, we can analyze and identify the following as resistance and support levels of Manta Network (MANTA) for 2025.
| Resistance Level 1 | $0.863 |
| Resistance Level 2 | $1.197 |
| Support Level 1 | $0.617 |
| Support Level 2 | $0.427 |
MANTA Resistance & Support Levels
Manta Network (MANTA) Price Prediction 2025 — RVOL, MA, and RSI
The technical analysis indicators such as Relative Volume (RVOL), Moving Average (MA), and Relative Strength Index (RSI) of Manta Network (MANTA) are shown in the chart below.
MANTA/USDT RVOL, MA, RSI (Source: TradingView)
From the readings on the chart above, we can make the following inferences regarding the current Manta Network (MANTA) market in 2025.
| INDICATOR | PURPOSE | READING | INFERENCE |
| 50-Day Moving Average (50MA) | Nature of the current trend by comparing the average price over 50 days | 50 MA = $0.698Price = $0.792 (50MA < Price) | Bullish/ Uptrend |
| Relative Strength Index (RSI) | Magnitude of price change;Analyzing oversold & overbought conditions | 62.802 <30 = Oversold 50-70 = Neutral>70 = Overbought | Neutral |
| Relative Volume (RVOL) | Asset’s trading volume in relation to its recent average volumes | Below cutoff line | Weak volume |
Manta Network (MANTA) Price Prediction 2025 — ADX, RVI
In the below chart, we analyze the strength and volatility of Manta Network (MANTA) using the following technical analysis indicators — Average Directional Index (ADX) and Relative Volatility Index (RVI).
MANTA/USDT ADX, RVI (Source: TradingView)
From the readings on the chart above, we can make the following inferences regarding the price momentum of Manta Network (MANTA).
| INDICATOR | PURPOSE | READING | INFERENCE |
| Average Directional Index (ADX) | Strength of the trend momentum | 16.148 | Weak Trend |
| Relative Volatility Index (RVI) | Volatility over a specific period | 65.43 <50 = Low >50 = High | High volatility |
Comparison of MANTA with BTC, ETH
Let us now compare the price movements of Manta Network (MANTA) with that of Bitcoin (BTC), and Ethereum (ETH).
BTC Vs ETH Vs MANTA Price Comparison (Source: TradingView)
From the above chart, we can interpret that the price action of MANTA is similar to that of BTC and ETH. That is, when the price of BTC and ETH increases or decreases, the price of MANTA also increases or decreases respectively.
Manta Network (MANTA) Price Prediction 2026, 2027 – 2030
With the help of the aforementioned technical analysis indicators and trend patterns, let us predict the price of Manta Network (MANTA) between 2026, 2027, 2028, 2029 and 2030.
| Year | Bullish Price | Bearish Price |
| Manta Network (MANTA) Price Prediction 2026 | $7 | $0.35 |
| Manta Network (MANTA) Price Prediction 2027 | $8 | $0.3 |
| Manta Network (MANTA) Price Prediction 2028 | $9 | $0.25 |
| Manta Network (MANTA) Price Prediction 2029 | $10 | $0.2 |
| Manta Network (MANTA) Price Prediction 2030 | $11 | $0.15 |
Conclusion
If Manta Network (MANTA) establishes itself as a good investment in 2025, this year would be favorable to the cryptocurrency. In conclusion, the bullish Manta Network (MANTA) price prediction for 2025 is $1.197. Comparatively, if unfavorable sentiment is triggered, the bearish Manta Network (MANTA) price prediction for 2025 is $0.427.
If the market momentum and investors’ sentiment positively elevate, then Manta Network (MANTA) might hit $5. Furthermore, with future upgrades and advancements in the Manta Network ecosystem, MANTA might surpass its current all-time high (ATH) of $4.08 and mark its new ATH.
FAQ
1. What is Manta Network (MANTA)?
Manta Network stands as a comprehensive ecosystem for zero-knowledge (ZK) applications, offering two distinct networks – Manta Pacific and Manta Atlantic.
2. Where can you purchase Manta Network (MANTA)?
Manta Network (MANTA) has been listed on many crypto exchanges, including Binance, Bybit, DigiFinex, Bitget, and Bitrue.
3. Will Manta Network (MANTA) reach a new ATH soon?
With the ongoing developments and upgrades within the Manta Network Platform, MANTA has a high possibility of reaching its ATH soon.
4. What is the current all-time high (ATH) of Manta Network (MANTA)?
On March 13, 2024, MANTA reached its new all-time high (ATH) of $4.08.
5. What is the lowest price of Manta Network (MANTA)?
According to CoinMarketCap, MANTA hit its all-time low (ATL) of $0.1564 on June 23, 2025.
6. Will Manta Network (MANTA) reach $5?
If Manta Network (MANTA) becomes one of the active cryptocurrencies that majorly maintain a bullish trend, it might rally to hit $10 soon.
7. What will be Manta Network (MANTA) price by 2026?
Manta Network (MANTA) price is expected to reach $6 by 2026.
8. What will be Manta Network (MANTA) price by 2027?
Manta Network (MANTA) price is expected to reach $7 by 2027.
9. What will be Manta Network (MANTA) price by 2028?
Manta Network (MANTA) price is expected to reach $8 by 2028.
10. What will be Manta Network (MANTA) price by 2029?
Manta Network (MANTA) price is expected to reach $9 by 2029.
Top Crypto Predictions
Binance Coin (BNB) Price Prediction
Ethereum Classic (ETC) Price Prediction
Decentraland (MANA) Price Prediction
Disclaimer: The opinion expressed in this chart is solely the author’s. It does not represent any investment advice. TheNewsCrypto team encourages all to do their own research before investing.