


- Solana (SOL) price is hovering around the $73 mark.
- The market is balanced and in a consolidation phase.
As of today, Solana (SOL) is trading at $73.96, up by 1%, with its trading volume at $1.85 billion, down 7%. That volume drop during a critical support test is noteworthy. Also, the market has seen $7.76 million in SOL liquidations over the past 24 hours, adding pressure to an already fragile structure.
The chart has not printed a green monthly candle since September 2025. Nine straight months of negative returns. The asset needs to stay above $73.50 for the next three days to break that streak. At the moment, it’s trading only $0.46 above that key level.
More than 50 million SOL were accumulated around $73.75, making it the single most critical support zone on the chart.
Solana’s Key Support and Resistance Levels
Holding the $73.75 zone and the falling wedge setup gives bulls the power. Following a breakout above wedge resistance opens the path above $80. Upon reclaiming, the next major target becomes $88.91.
Losing the $73.75 range with a sustained close below it and fresh selling pressure kicks in fast. In that case, $60 becomes the next target, with support between there and $50 below that.
A falling wedge with buyers defending the lower trendline shows accumulation behaviour.
Analysing SOL’s Technical Structure
SOL’s Moving Average Convergence Divergence line is just below the signal line, and the recent bounce has stalled out, and short-term selling pressure is taking control again. As both lines are below zero, the overarching market environment remains bearish. This setup indicates an early re-acceleration down.
The MACD line is only a few points below the signal line, showing a fresh bearish crossover has either taken place or short-term downward momentum is slightly outpacing the average. This is a high-probability continuation sign for the downtrend.
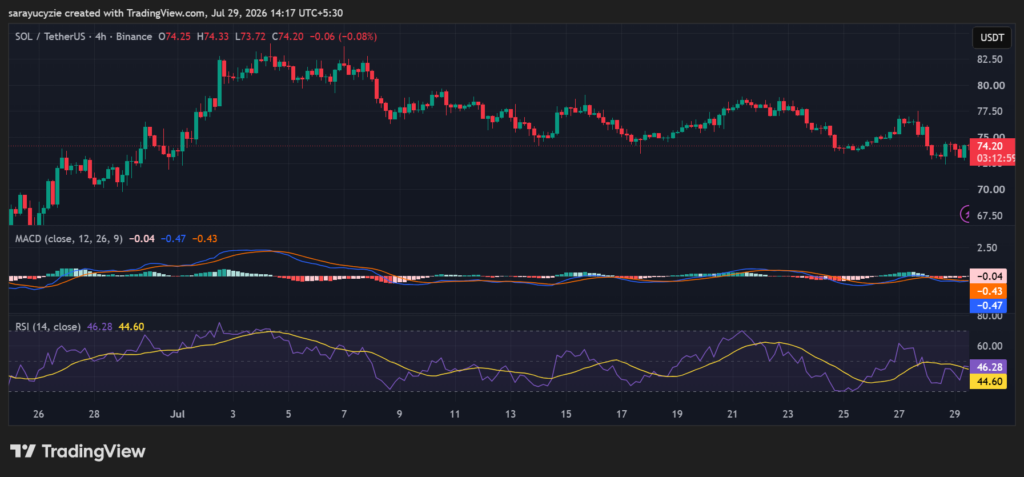
Additionally, the daily Relative Strength Index of Solana is at 46.28 and sits in slightly bearish neutral territory. As it is slightly below the 50 centerline, sellers hold a very subtle edge over momentum, keeping the price action slightly tilted downward.
The market is balanced and effectively in a consolidation phase. There is no extreme momentum in either direction. Traders wait for the RSI to break above 50–55 to signal a fresh bullish push or drop below 40 for a stronger bearish breakdown.
Crypto Market Highlights
Cardano (ADA) Tests a Critical Zone After a 4% Jump: Can Bulls Drive the Price Toward $0.20?