
- Jito (JTO) is currently hovering around $1.56.
- If the $1.60 support level holds, it could trigger a rally to $2.70.
With a modest recovery in the crypto industry, the tokens have taken a double stand, moving up and down. The largest asset, Bitcoin, is seeking to reclaim the lost momentum, currently trading at around $113.6K. Meanwhile, Ethereum (ETH), the largest altcoin, is following the path of BTC and hovering at $4.1K.
The market direction seems unclear, with both green and red flags waving across the assets. Upon the bullish pressure gaining enough traction, the price movement might go instantly upward, and vice versa. Notably, the altcoin, Jito (JTO), has registered a drop of over 2.14% in the last 24 hours.
The asset’s daily high and low prices were noted at $1.61 and $1.56, respectively. At the time of writing, Jito traded at around the same bottom level of the $1.56 range, with a market cap of $600.92 million. Additionally, the daily trading volume has spiked by over 10.69%, reaching $26.41 million.
The Ali chart shows that JTO is currently holding the $1.60 support level. If this level holds, it acts as a strong foundation for price action. A successful defence could trigger a rally toward $2.70, and if momentum continues, possibly up to $4.70. Also, losing $1.60 would weaken the bulls and open the door for more downside.
Assessing Current Market Momentum and Price Trajectory of Jito
The JTO/USDT pair gives a negative outlook, reinforcing the recent downtrend. Multiple red candlesticks have been lighted, engulfing the classic bearish signal. If the bears strengthen, the price might slip toward a support below the $1.50 mark. Contrarily, assuming the bulls stepped in, the asset could climb to its nearby resistance level above $1.56.
The technical analysis of Jito exhibits that the MACD line and the signal line are settled below the zero line, which indicates bearish momentum in the market. The asset is in a downtrend, with sellers currently stronger than buyers. The further it falls below zero, the stronger the bearish sentiment gets.
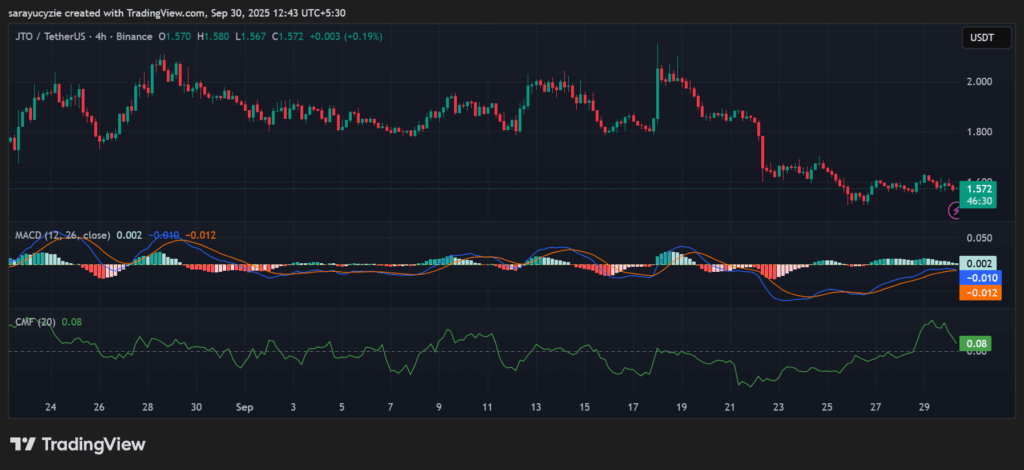
Besides, the CMF indicator value of 0.08 suggests slight buying pressure in the market. Since it is above 0, there is more accumulation than distribution, but the momentum is moderate, not so strong. This is a cautious bullish signal, and the traders may wait for a stronger confirmation.
Moreover, the daily RSI is found at 43.07, which hints at a slightly bearish to neutral momentum. With this value, the market shows mild weakness but is far from extreme. Jito’s BBP reading of -0.023 points to a bearish dominance, and the market is nearly balanced, with only mild selling pressure. Yet, caution is warranted.
Overall, the asset’s chart shows encouraging signs of bears dominating. There are chances for both upside and downside corrections to take place in the JTO market. For deeper insights into where the Jito price could be heading next, check out our Jito (JTO) Price Prediction 2025, 2026-2030.
Top Updated Crypto News
Can Ethereum (ETH) Keep the Green Line Alive? $4.3K Barrier Tests Bullish Momentum