
- Bitcoin’s price showed an additional 2.54% drop in the last 24 hours.
- The cryptocurrency’s daily trading volume showed a 0.33% increase as per CMC data.
While the world mourns the passing of tech giant Ratan Tata, cryptocurrency prices fell in the last 24 hours. The community also received news about the US FBI’s creation of a new token to entrap suspects involved in market manipulation. Meanwhile, the largest cryptocurrency has yet again initiated a bearish price cycle in the past day.
Notably, the altcoin sector also reflected the bearish sentiment as leading altcoins Ethereum and Solana fell to previous support levels. Bitcoin has recorded an additional 2.54% price decline revisiting its consistent support level at $60K.
This bearish cycle continues the token’s dip from its opening price of $62,000. As the day progressed, the token fell to an intra-day low of $60,317. According to CMC data, at the time of writing, BTC was trading at $60,981.
Zooming out, on inferring the digital asset’s weekly price chart, it depicts a persistent downward pressure in price actions. At the beginning of the week, the token was trading at $60,153, however, in the following days, Bitcoin showed price increases. Following this, contrary to expectations, the digital asset failed to sustain the positive momentum and has bounced back to last week’s price cycle.
Parallely, the US spot Bitcoin ETFs have also shown negative inflows in the last trading day. According to Sosovalue data, the ETFs recorded an outflow of $30.59 million as of October 9, continuing the previous day’s outflows. Specifically, Ark Invest and 21Shares’s ARKB recorded the highest outflow of $44.47 million.
Will Bitcoin Price Overcome the Bearish Pressure?
As the first quarter of the month approaches an end, there has been no sight of the bullish cycles that begin in October (Uptober). The community, investors, and market analysts alike have been keenly watching Bitcoin’s price actions.
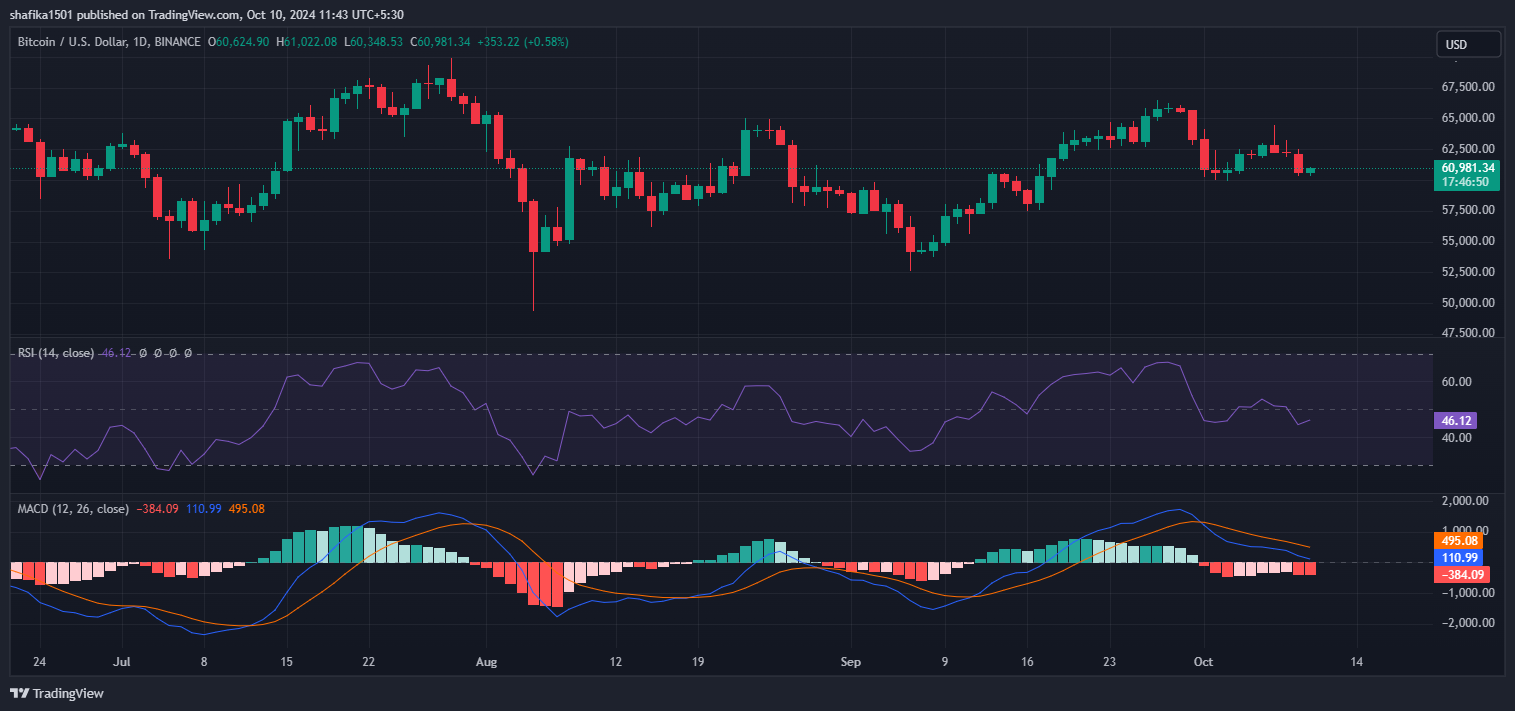
On inferring TradingView data, Bitcoin’s Moving Average Convergence Divergence (MACD) signal line stands below the MACD line suggesting a negative market sentiment. Additionally, the continuous price drop has rendered Bitcoin to lean toward an oversold state as indicated by the RSI with a value of 46.12.
However, market analysts’ previous predictions suggest a depreciation before the bullish cycles. This has led members to hold out for the bullish cycles to begin later this month. Meanwhile, other altcoins such as WorldCoin and SUI have also garnered market attention for their intriguing price activity.
Highlighted Crypto News Today:
Thai SEC Proposes New Regulations for Fund Investments in Crypto Assets