
- Bitcoin is priced at $56,251, showing a 10.94% decline since September began and a continued bearish trend.
- Bitcoin ETF sees a $116.96 million inflow on the second consecutive day after a week of outflows.
September has historically been a challenging month for both U.S. stocks and cryptocurrencies, and this year is no different for Bitcoin. The leading cryptocurrency has recently faced a tough time, with its value fluctuating significantly from $58K to $55K.
Bitcoin initially dropped below the $57K mark on September 2. Although it briefly climbed to $59K on September 3, it couldn’t sustain this level and has been struggling to gain momentum above $58,000. Then, on September 7, BTC hit a low of $52,872—a monthly low, marking a notable decline of 10.94%. This downturn has increased selling pressure and created a challenging environment for traders.
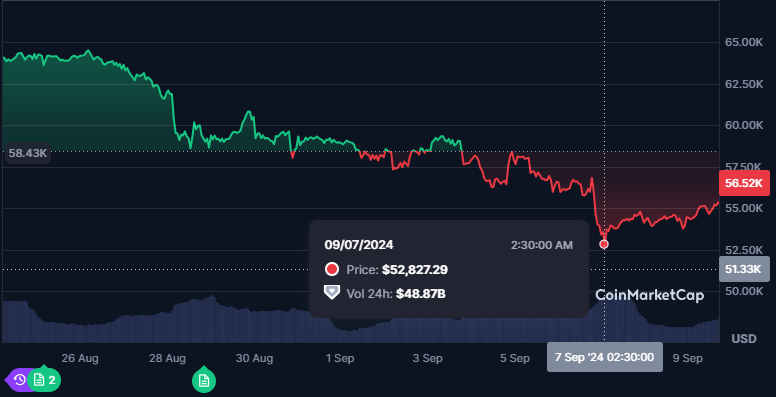
At the time of writing, the cryptocurrency was priced at $56,522, with a market cap of $1.11 trillion. In the past 24 hours, Bitcoin saw a further decrease of 1.16%, erasing the progress it made yesterday. Additionally, the daily trading volume has dropped by over 8% to $30 billion, according to CoinMarketCap data. Further, the Bitcoin fear and greed index remains in the fear zone at 37, reflecting the cautious sentiment in the market.
Looking Ahead for Bitcoin
The recent downward trend in Bitcoin’s price has been persistent over the past month, with the asset losing more than 3.75% in the last 7 days. Further, technical indicators suggest that BTC has been unable to break free from the bearish trend.
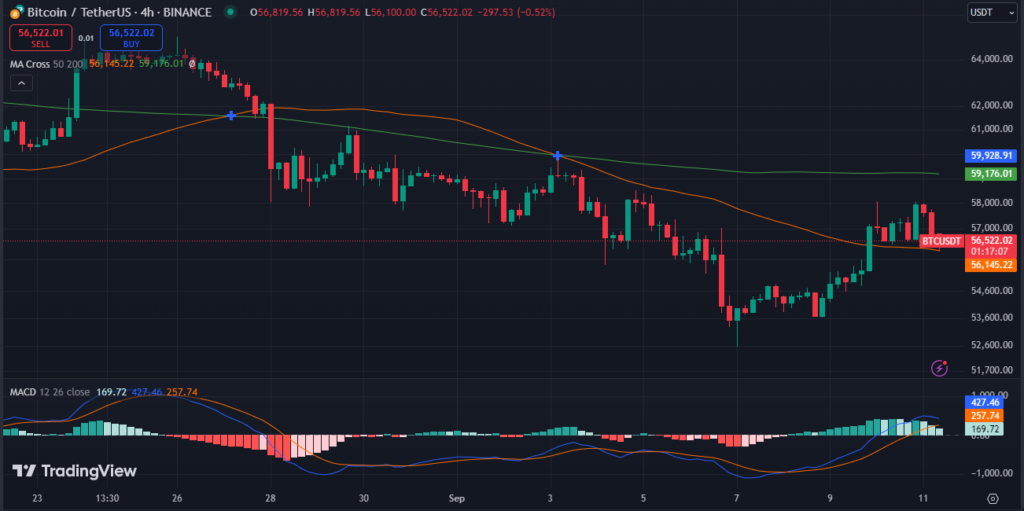
According to TradingView, both the short-term 50-day and the long-term 200-day moving averages are positioned above the current price, indicating continued downward momentum.
Additionally, the daily relative strength index (RSI) is at 43.84, approaching the neutral zone. The MACD (moving average convergence divergence) is also showing bearish signals, with the MACD line below the signal line. This setup indicates a prolonged bearish trend in the Bitcoin market.
If this trend continues, Bitcoin could potentially revisit its 2024 low of $38,500, which was recorded on January 23. A bullish market could emerge around March or October 2025. Explore long-term Bitcoin price prediction for more insights.