

- Bullish HT price prediction for 2023 is $2.6725 to $3.7268.
- HTX Token (HT) price might reach $5 soon.
- Bearish HT price prediction for 2023 is $1.3386.
In this HTX Token (HT) price prediction for 2023, 2024-2030, we will analyze the price patterns of HT by using accurate trader-friendly technical analysis indicators and predict the future movement of the cryptocurrency.
TABLE OF CONTENTS |
INTRODUCTION |
|
HTX TOKEN (HT) PRICE PREDICTION 2023 |
|
| HTX TOKEN (HT) PRICE PREDICTION 2024, 2025, 2026-2030 |
| CONCLUSION |
| FAQ |
Huobi Token (HT) Current Market Status
| Current Price | $2.40 | 24 – Hour Price Change | 2.56% High |
| 24 – Hour Trading Volume | $10,763,543 |
| Market Cap | $388,566,725 |
| Circulating Supply | 162,233,844 HT | All – Time High | $39.81 (May 12, 2021) |
| All – Time Low | $0.8903 (On Jan 30, 2019) |
What is Huobi Token (HT)
| TICKER | HT |
| BLOCKCHAIN | Etehreum |
| CATEGORY | Decentralized digital asset |
| LAUNCHED ON | January 2018 |
| UTILITIES | Governance, security, gas fees & rewards |
HTX Token (HT) is the native cryptocurrency of the Huobi Global exchange. It was founded in 2018 and facilitates on-platform governance, rewards, and special event access. It became popular among the early investors which let users invest in trading and Initial Coin Offerings (ICOs).
HTX Token 24H Technicals
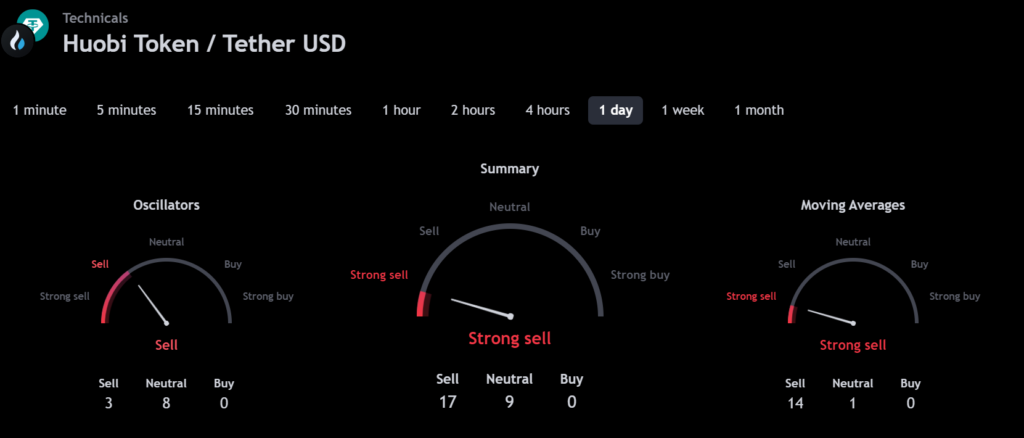
(Source: TradingView)
HTX Token (HT) Price Prediction 2023
HTX Token (HT) ranks 78th on CoinMarketCap in terms of its market capitalization. The overview of the HTX Token price prediction for 2023 is explained below with a daily time frame.
HT/USDT Descending Channel Pattern (Source: TradingView)
In the above chart, HTX Token (HT) laid out a descending channel pattern. Descending channel patterns are short-term bearish in that a stock moves lower within a descending channel, but they often form longer-term uptrends as continuation patterns. The descending channel pattern is often followed by higher prices. but only after an upside penetration of the upper trend line. A descending channel is drawn by connecting the lower highs and lower lows of a security’s price with parallel trendlines to show a downward trend.
Within a descending channel, a trader could make a selling bet when the security price reaches its resistance trendline. An ascending channel is the opposite of a descending channel. Both ascending and descending channels are primary channels followed by technical analysts.
At the time of analysis, the price of HTX Token (HT) was recorded at $2.40. If the pattern trend continues, then the price of HT might reach the resistance levels of $2.9970, $3.5081, and $4.0870. If the trend reverses, then the price of HT may fall to the support of $2.1553.
HTX Token (HT) Resistance and Support Levels
The chart given below elucidates the possible resistance and support levels of HTX Token (HT) in 2023.
HT/USDT Resistance and Support Levels (Source: TradingView)
From the above chart, we can analyze and identify the following as the resistance and support levels of HTX Token (HT) for 2023.
| Resistance Level 1 | $2.6725 |
| Resistance Level 2 | $3.7268 |
| Support Level 1 | $1.9224 |
| Support Level 2 | $1.3386 |
HT Resistance & Support Levels
HTX Token (HT) Price Prediction 2023 — RVOL, MA, and RSI
The technical analysis indicators such as Relative Volume (RVOL), Moving Average (MA), and Relative Strength Index (RSI) of HTX Token (HT) are shown in the chart below.
HT/USDT RVOL, MA, RSI (Source: TradingView)
From the readings on the chart above, we can make the following inferences regarding the current HTX Token (HT) market in 2023.
| INDICATOR | PURPOSE | READING | INFERENCE |
| 50-Day Moving Average (50MA) | Nature of the current trend by comparing the average price over 50 days | 50 MA = $2.4894Price = $2.3727 (50MA > Price) | Bearish(Downtrend) |
| Relative Strength Index (RSI) | Magnitude of price change;Analyzing oversold & overbought conditions | 45.25 <30 = Oversold 50-70 = Neutral>70 = Overbought | Neraly Oversold |
| Relative Volume (RVOL) | Asset’s trading volume in relation to its recent average volumes | Below cutoff line | Weak Volume |
HTX Token (HT) Price Prediction 2023 — ADX, RVI
In the below chart, we analyze the strength and volatility of HTX Token (HT) using the following technical analysis indicators — Average Directional Index (ADX) and Relative Volatility Index (RVI).
HT/USDT ADX, RVI (Source: TradingView)
From the readings on the chart above, we can make the following inferences regarding the price momentum of HTX Token (HT).
| INDICATOR | PURPOSE | READING | INFERENCE |
| Average Directional Index (ADX) | Strength of the trend momentum | 39.1541 | Strong Trend |
| Relative Volatility Index (RVI) | Volatility over a specific period | 65.18 <50 = Low >50 = High | High Volatility |
Comparison of HT with BTC, ETH
Let us now compare the price movements of HTX Token (HT) with that of Bitcoin (BTC), and Ethereum (ETH).
BTC Vs ETH Vs HT Price Comparison (Source: TradingView)
From the above chart, we can interpret that the price action of HT is similar to that of BTC and ETH. That is, when the price of BTC and ETH increases or decreases, the price of HT also increases or decreases respectively.
HTX Token (HT) Price Prediction 2024, 2025 – 2030
With the help of the aforementioned technical analysis indicators and trend patterns, let us predict the price of HTX Token (HT) between 2024, 2025, 2026, 2027, 2028, 2029 and 2030.
| Year | Bullish Price | Bearish Price |
| HTX Token (HT) Price Prediction 2024 | $6 | $2 |
| HTX Token (HT) Price Prediction 2025 | $8 | $2.5 |
| HTX Token (HT) Price Prediction 2026 | $11 | $3.3 |
| HTX Token (HT) Price Prediction 2027 | $15 | $3.6 |
| HTX Token (HT) Price Prediction 2028 | $18 | $3.7 |
| HTX Token (HT) Price Prediction 2029 | $20 | $3.9 |
| HTX Token (HT) Price Prediction 2030 | $25 | $4 |
Conclusion
If HTX Token (HT) establishes itself as a good investment in 2023, this year would be favorable to the cryptocurrency. In conclusion, the bullish HTX Token (HT) price prediction for 2023 is $3.7268. Comparatively, the bearish HTX Token (HT) price prediction for 2023 is $1.3386.
If there is a positive elevation in the market momentum and investors’ sentiment, then HTX Token (HT) might hit $5. Furthermore, with future upgrades and advancements in the HTX Token ecosystem, HT might surpass its current all-time high (ATH) of $39.81 and mark its new ATH.
FAQ
1. What is HTX Token (HT)?
HTX Token is an ecosystem token launched by Huobi Global, which offers benefits such as trading fees and margin discounts and access to certain trading events.
2. Where can you buy HTX Token (HT)?
HTX Token (HT) has been listed on many crypto exchanges which include Huobi Global, LBank,BitMart , Gate.io, and MEXC
3. Will HTX Token (HT) record a new ATH soon?
With the ongoing developments and upgrades within the HTX Token platform, HTX Token (HT) has a high possibility of reaching its ATH soon.
4. What is the current all-time high (ATH) of HTX Token (HT)?
HTX Token (HT) hit its current all-time high (ATH) of $39.81 on May 12, 2021.
5. What is the lowest price of HTX Token (HT)?
According to CoinMarketCap, HT hit its all-time low (ATL) of $0.8903 on Jan 30, 2019.
6. Will HTX Token (HT) hit $5?
If HTX Token (HT) becomes one of the active cryptocurrencies that majorly maintain a bullish trend, it might rally to hit $5 soon.
7. What will be the HTX Token (HT) price by 2024?
HTX Token (HT) price might reach $6 by 2024.
8. What will be the HTX Token (HT) price by 2025?
HTX Token (HT) price might reach $8 by 2025.
9. What will be the HTX Token (HT) price by 2026?
HTX Token (HT) price might reach $11 by 2026.
10. What will be the HTX Token (HT) price by 2027?
HTX Token (HT) price might reach $15 by 2027.
Top Crypto Predictions
Pepe (PEPE) Price Prediction 2023
Waves (WAVES) Price Prediction 2023
Avalanche (AVAX) Price Prediction 2023
Disclaimer: The opinion expressed in this chart is solely the author’s. It does not represent any investment advice. TheNewsCrypto team encourages all to do their own research before investing.