- Standard Chartered lowered its 2026 Bitcoin price target from $150,000 to $100,000 and said BTC could decline toward $50,000 in the near term.
- BTC is trading near $66,400, below its 50-week moving average, with technical indicators showing continued weakness.
Standard Chartered has lowered its price forecast for Bitcoin (BTC) and warned that the cryptocurrency could decline toward $50,000 before any sustained recovery later in the year. The reduction comes amid ongoing macro headwinds, outflows from exchange-traded products, and continued weakness that led BTC to trade below the $70K zone.
In a research note by Geoffrey Kendrick, head of digital assets research at Standard Chartered, the bank cut its 2026 year-end Bitcoin target from $150,000 to $100,000. The revised outlook, the second downgrade in less than three months, includes a near-term projection that Bitcoin could test levels around $50,000. Kendrick cited persistent outflows from spot Bitcoin ETFs and a weaker macroeconomic backdrop as key pressures on the market. The $50,000 level was highlighted as a potential downside scenario if selling pressure persists.
Bitcoin Technical Indicators Signal Continued Weakness
Current BTC price action aligns with this cautious outlook. On the weekly BTC/USDT chart, Bitcoin is trading near $66,400, significantly below the 50-week simple moving average, which stands around $99,700. The break below this moving average confirms a loss of medium-term trend support. Price is now approaching the 200-week moving average near $58,200, a level that historically acts as structural support during broader market corrections.
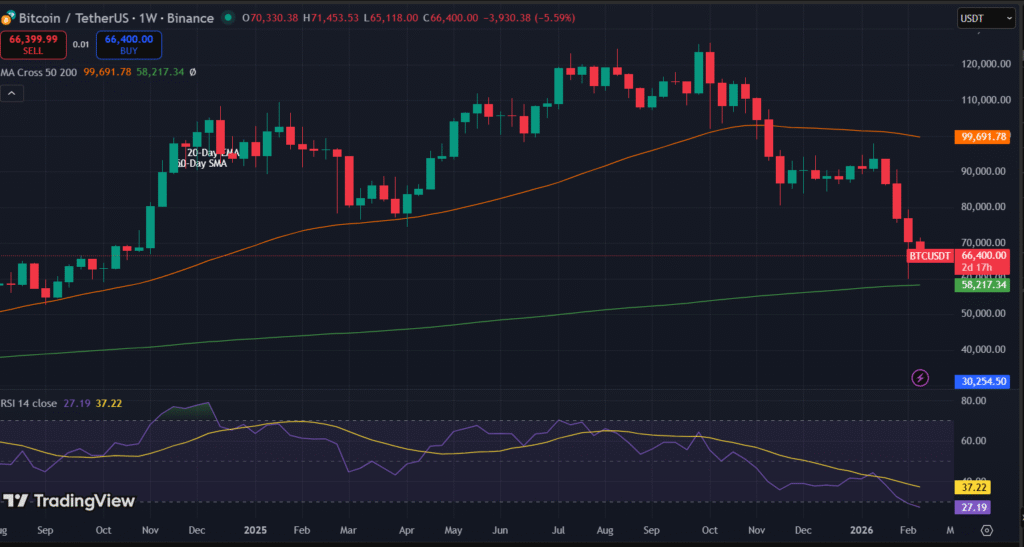
Zooming in, the momentum indicators also reflect weakness. The weekly Relative Strength Index (RSI) is in the high-20s to mid-30s range, indicating oversold conditions. However, oversold readings alone do not confirm a reversal and can persist during sustained downtrends. The moving average structure remains bearish, with shorter-term averages positioned below longer-term ones, reinforcing the prevailing downward bias.
On a technical basis, the $60,000 to $58,000 area has now acted as support. Should this level fail decisively on a weekly close, the next meaningful support sits near the long-term 200-week average. On the upside, resistance is visible between $80,000 and $90,000, where prior consolidation occurred before the recent decline.
Standard Chartered’s note frames the potential drop toward $50,000 as part of a “capitulation” phase prior to a recovery later in 2026. The bank still expects Bitcoin to end the year higher than current levels, but its forecast reflects a more cautious near-term outlook consistent with recent price patterns and technical indicators.