
- Raydium leads the losers, plunging over 33%.
- RAY’s daily trading volume has skyrocketed by 421%.
The leading DEX on Solana, Raydium (RAY), took the biggest blow and slipped over 33.27%. The drop follows the report that Pump.fun, a Solana-based token issuance platform, is planning to launch its automated market maker (AMM).
A replacement of Raydium for its AMM would result in a bearish sentiment for RAY’s long-term outlook and could challenge its dominance in Solana DEX services.
It is currently going through the testing phase. This allows users to trade cryptocurrencies directly against liquidity in smart contracts, making a traditional counterparty unnecessary.
RAY’s downside correction caused it to drop from $4.27 to $2.83, making it the top loser. At the time of writing, the asset traded at $2.85, with its daily trading volume reaching $326 million.
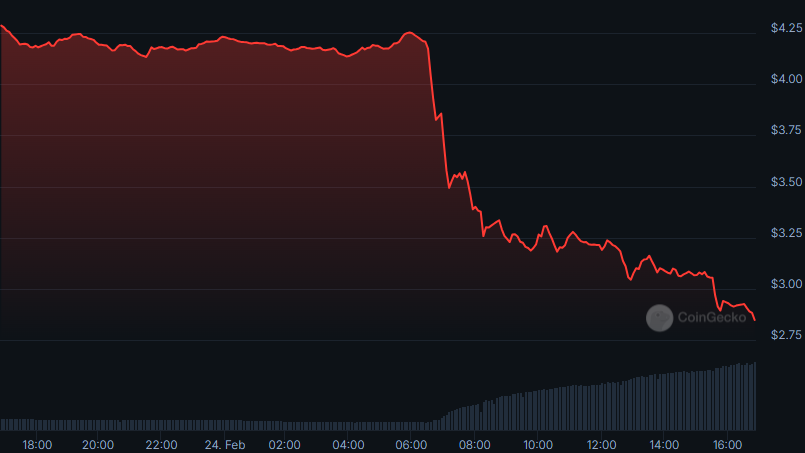
Notably, the asset has formed a bearish pattern over the last thirty days, losing over 60.80%. The bears sustained throughout without a reversal. Over the last seven days, Raydium dropped around 41.80%. RAY continued to lose momentum and reached the lowest trading level.
Can RAY Break Free from the Bearish Pressure?
The bearish pressure of RAY caused it to shed its recent gains and plummet below the crucial support zones. Assuming the support zone at $3.07 fails to hold, the Raydium price could plunge to the unforeseen $2 mark.
In case of a trend reversal, the asset price could immediately test the $3.16 resistance. Raydium’s extended bullish momentum might bring in a golden cross to kickstart a potential rally toward a high of $5 or above.
Raydium’s Moving Average Convergence Divergence (MACD) line and signal line are positioned below the zero line. This indicates a strong bearish crossover and selling pressure is dominant in the market.
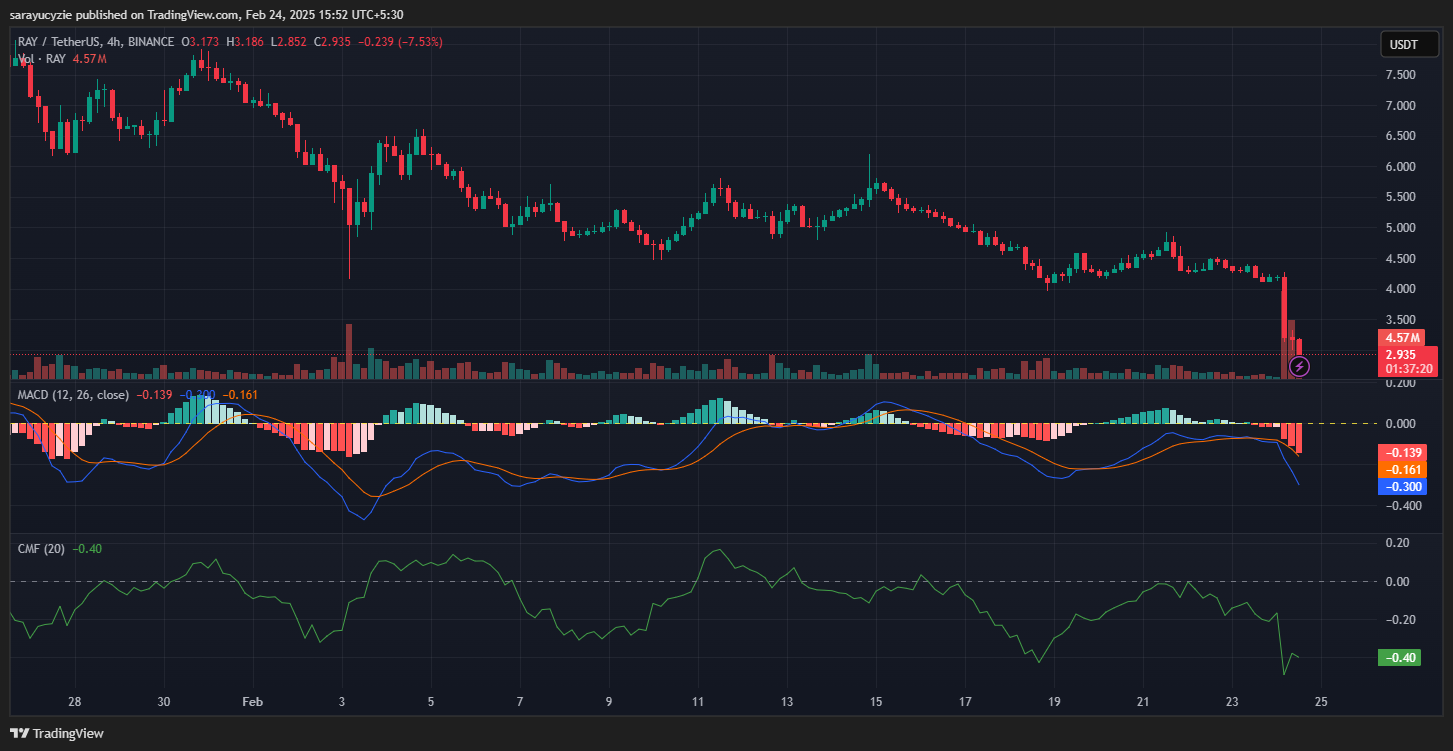
The Chaikin Money Flow (CMF) indicator at -0.40 signals that the money is flowing out of the asset with the sellers in control of the market. Meanwhile, RAY’s daily trading volume has increased by 421%.
In addition, the trading chart displays the Bull Bear Power (BBP) value of -1.662 suggesting that bears are in control, with selling pressure outweighing buying momentum. Raydium’s daily relative strength index (RSI) at 18.21 points out that the asset is oversold.