In FTX Coin (FTT) Technical Analysis 2021, we use past statistics, Price Analysis, RSI, and various other FTT information to analyze the future trend of cryptocurrencies.
The FTX team includes some of the largest cryptocurrency traders in the past few years. Given the problems of most major cryptocurrency futures exchanges, they decided to launch their platform. FTX claims that it features functions such as clawback prevention, a centralized collateral pool, and universal stablecoin processing.
In regards to clawback prevention, a considerable part of client funds was recovered in other futures exchanges as compensation for social losses. FTX reduces this situation by using a three-tiered liquidation model.
Another feature of FTT is leveraged tokens, which allow traders to place leveraged positions without using margin for trading. FTX currently offers leveraged tokens XRP, BNB, TRX, BTC, ETH, EOS, USDT, and LEO. Moreover, FTT is an ERC20 Ethereum token.
FTX Coin (FTT) Current Market Status
According to CoinGecko, the FTT price is trading at $34 with a 24-hour trading volume of $53,690,390, at the time of writing. However, FTT has increased by 1.4% in the last 24 hours.
Moreover, FTT has a circulating supply of 87,143,349 FTT. Currently, FTT trades in Binance, Huobi Global, FTX, HitBTC, and Bitcoin.com Exchange.
FTX Coin (FTT) Technical Analysis 2021
The recent development and upgrades might push FTX Coin (FTT) to reach new heights. Now, let’s deep dive into the FTT technical analysis 2021. The daily time frame chart of FTX (FTT) is shown below.
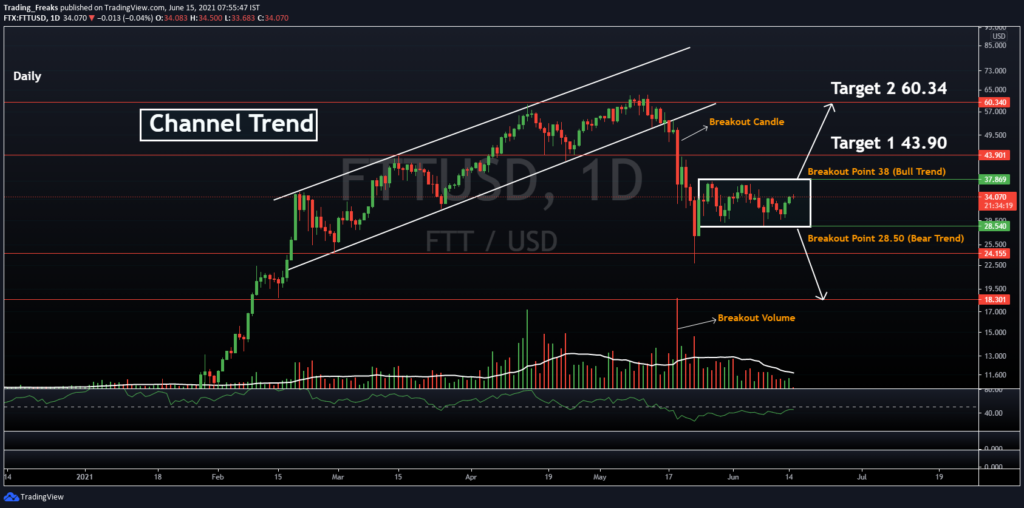
The above chart shows the formation of the “Channel Trend pattern”. This pattern started in Feb-2021 and then price broke the trend line support level with wide range candle and support of expanded volume in Mid of May-2021. This signal indicates the bearish trend which started on 19th May 2021 and then the price plummeted to the previous resistance area.
After the huge sell-off, currently, the trend is in the “Consolidation phase” in which prices are traded within a certain range ($28.5 – $37.8). If the price breakout at $28.5 means it will fall to $18.3 which is a bear trend. Or else, if the price breakout at $38 means it will reach the price up to $60.3 which forms a bull trend. Notably, the RSI of FTT is below 50 which indicates the price at a good discount, so the price of the token surely reaches the Target of $60.
FTX Coin (FTT) RSI, RVOL, and MA
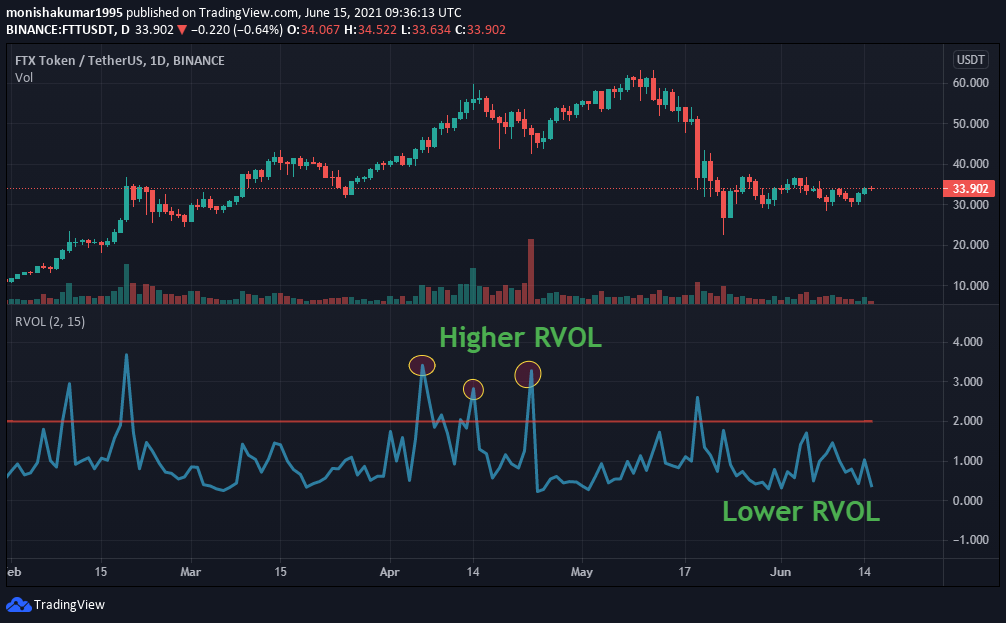
The below chart shows the Relative Volume (RVOL) of FTT. Generally, Relative trading volume is a trading indicator, which is used by day traders to compare the current trading volume with the normal trading volume in the past. Notably, between April and May, it is found that the RVOL stays three times above the cut-off line making a Higher RVOL. From mid of May month to till at the time of writing, the RVOL stays below the cut-off line which indicates the weaker participants in the trend.
Now let’s look at the relative strength index (RSI) of FTT. As shown in the below chart, RSI remains at 45. This shows that FTT’s price is in a nearly oversold state. However, this indicates a major price reversal could occur in the upcoming days. So, traders need to trade carefully.

FTT’s Moving Average (MA) and Exponential Moving Average (EMA) is shown in the chart below. MA is a crypto indicator widely used in technical analysis. The reason for calculating the crypto moving average is to smooth the price data over a period of time by creating a constantly updated average price. While EMA is a type of moving average.
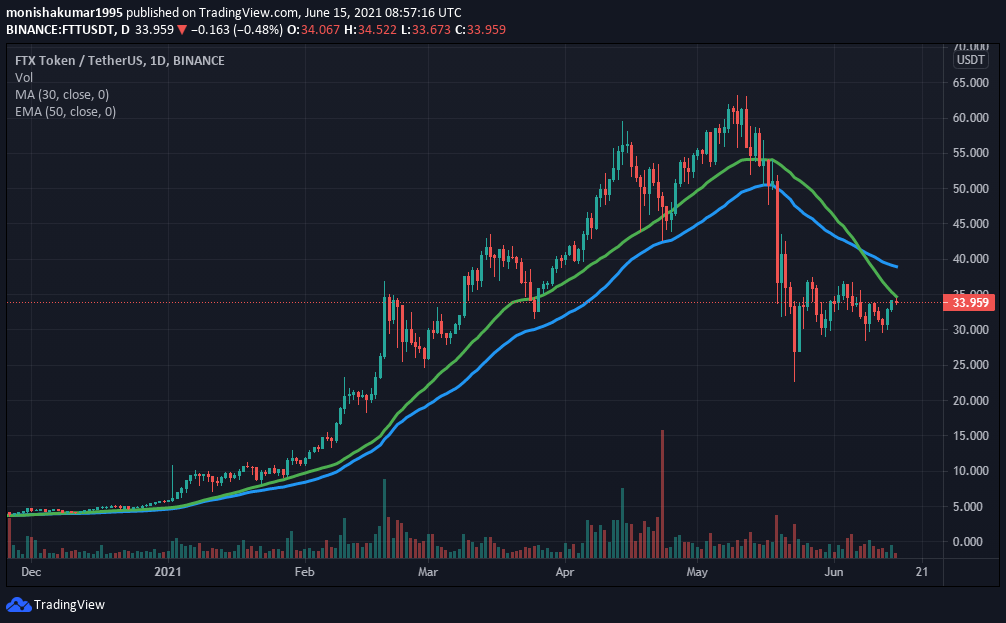
From the beginning of 2021, it is clear that the FTT price has shown many bullish patterns. Furthermore, taking all these into account, FTT could have a competitive market in 2021.
Conclusion
With the ongoing developments and upgrades that are taking place within the FTT platform. The cryptocurrency FTT has a fantastic future ahead in this crypto market. However, it is possible to see FTT reaching new heights.
Bullish FTT price prediction 2021 is $60. As said above, it may reach great heights, however reaching $85, if investors have decided that FTT is a good investment in 2021.
FAQ
FTX token is a cryptocurrency derivatives exchange that provides futures, leveraged tokens, and OTC trading. At present, futures exchanges have many crippling flaws that hold up space. Its task is to solve these problems and bring the derivatives market to the institutional level. Its native token is FTT.
FTT is listed on many cryptocurrency exchanges that include Binance, Huobi Global, FTX, HitBTC, and Bitcoin.com Exchange. It is available for trading against crypto fiat coins, stablecoins, and other cryptocurrencies.
With the ongoing developments and upgrades within the FTT platform, it has the high possibility of reaching its ATH soon.
Disclaimer: The opinion expressed in this chart solely author’s. It does not interpreted as investment advice. TheNewsCrypto team encourages all to do their own research before investing.