
- Bullish EOS price prediction for 2025 is $0.6967 to $1.0397.
- EOS (EOS) price might reach $3 soon.
- Bearish EOS price prediction for 2025 is $0.2932.
In this EOS (EOS) price prediction 2025, 2026-2030, we will analyze the price patterns of EOS by using accurate trader-friendly technical analysis indicators and predict the future movement of the cryptocurrency.
TABLE OF CONTENTS |
INTRODUCTION |
|
EOS (EOS) PRICE PREDICTION 2025 |
|
| EOS (EOS) PRICE PREDICTION 2026, 2027-2030 |
| CONCLUSION |
| FAQ |
EOS (EOS) Current Market Status
| Current Price | $0.6852 | 24 – Hour Price Change | 16.17% Up |
| 24 – Hour Trading Volume | $373.41M |
| Market Cap | $1.06B |
| Circulating Supply | 1.55B EOS | All – Time High | $22.89 (On April 29, 2018) |
| All – Time Low | $0.4015 (On Nov 05, 2024) |
What is EOS (EOS)?
| TICKER | EOS |
| BLOCKCHAIN | EOS.IO Blockchain |
| CATEGORY | DPoS Token |
| LAUNCHED ON | June 2018 |
| UTILITIES | Governance, gas fees & rewards |
EOS is the native cryptocurrency of the EOS.IO blockchain, a decentralized operating system that launched in June 2018. The network was created by Block.one, a software company.
The EOS (Electro-Operating System) network allows users and developers to create and deploy decentralized applications (dApps) using smart contracts on the blockchain. Transactions on the EOS.IO blockchain are secured through a delegated proof-of-stake (DPoS) consensus mechanism that incorporates Byzantine Fault Tolerance (BFT).
The EOS initial coin offering (ICO), held from 2017 to 2018 over an 11-month period, is known as one of the largest token sales in history. EOS token holders gain access to the bandwidth and storage capabilities of the EOS.IO network.
Recently, the EOS Network successfully completed its Spring 1.0 upgrade, a hard fork that introduced 1-second transaction finality to the blockchain. On September 25, the EOS Network announced that the upgrade to Antelope Spring 1.0 represents a significant advancement for both the network and the wider cryptocurrency industry. With the implementation of the Savanna consensus algorithm, EOS now offers transaction finality that is 100 times faster than its previous version.
EOS (EOS) 24H Technicals
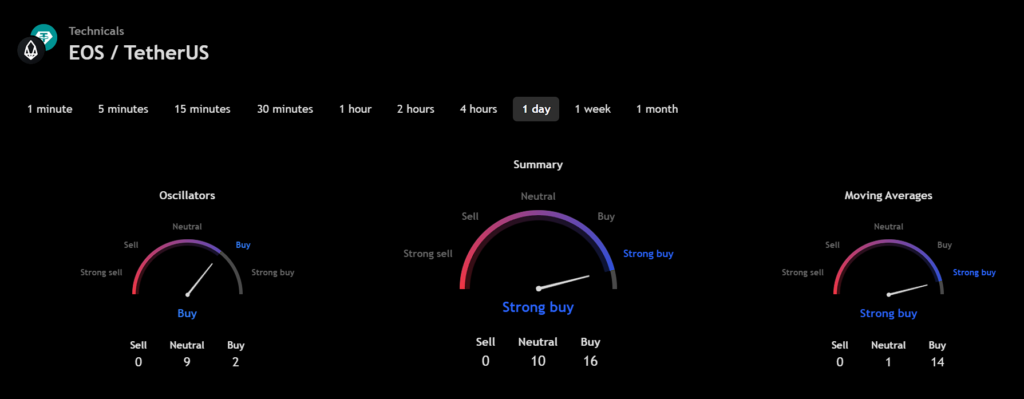
(Source: TradingView)
EOS (EOS) Price Prediction 2025
EOS (EOS) ranks 63rd on CoinMarketCap in terms of its market capitalization. The overview of the EOS price prediction for 2025 is explained below with a daily time frame.
EOS/USDT Descending Channel Pattern (Source: TradingView)
In the above chart, EOS (EOS) laid out a descending channel, also known as a falling channel, which is a bearish technical analysis pattern formed by two parallel downward-sloping trendlines. The upper trendline connects a series of high points, indicating resistance where the price struggles to rise above, while the lower trendline connects the lower points, acting as support.
This pattern suggests that sellers are in control, with the price consistently making lower highs and lower lows. Traders often look to sell near the upper trendline and buy near the lower trendline, as the price typically oscillates within this defined range. Overall, the descending channel helps traders identify potential shorting opportunities and assess market sentiment.
At the time of analysis, the price of EOS (EOS) was recorded at $0.6852. If the pattern trend continues, then the price of EOS might reach the resistance levels of $0.6547 and $1.5338. If the trend reverses, then the price of EOS may fall to the support of $0.4216.
EOS (EOS) Resistance and Support Levels
The chart given below elucidates the possible resistance and support levels of EOS (EOS) in 2025.
EOS/USDT Resistance and Support Levels (Source: TradingView)
From the above chart, we can analyze and identify the following as resistance and support levels of EOS (EOS) for 2025.
| Resistance Level 1 | $0.6967 |
| Resistance Level 2 | $1.0397 |
| Support Level 1 | $0.4408 |
| Support Level 2 | $0.2932 |
EOS Resistance & Support Levels
EOS (EOS) Price Prediction 2025 — RVOL, MA, and RSI
The technical analysis indicators such as Relative Volume (RVOL), Moving Average (MA), and Relative Strength Index (RSI) of EOS (EOS) are shown in the chart below.
EOS/USDT RVOL, MA, RSI (Source: TradingView)
From the readings on the chart above, we can make the following inferences regarding the current EOS (EOS) market in 2025.
| INDICATOR | PURPOSE | READING | INFERENCE |
| 50-Day Moving Average (50MA) | Nature of the current trend by comparing the average price over 50 days | 50 MA = $0.5002Price = $0.4672 (50MA > Price) | Bearish/Downtrend |
| Relative Strength Index (RSI) | Magnitude of price change;Analyzing oversold & overbought conditions | 37.9214 <30 = Oversold 50-70 = Neutral>70 = Overbought | Oversold |
| Relative Volume (RVOL) | Asset’s trading volume in relation to its recent average volumes | Below cutoff line | Weak volume |
EOS (EOS) Price Prediction 2025 — ADX, RVI
In the below chart, we analyze the strength and volatility of EOS (EOS) using the following technical analysis indicators — Average Directional Index (ADX) and Relative Volatility Index (RVI).
EOS/USDT ADX, RVI (Source: TradingView)
From the readings on the chart above, we can make the following inferences regarding the price momentum of EOS (EOS).
| INDICATOR | PURPOSE | READING | INFERENCE | |
| Average Directional Index (ADX) | Strength of the trend momentum | 12.9580 | Weak Trend | |
| Relative Volatility Index (RVI) | Volatility over a specific period | 54.08 <50 = Low >50 = High | High volatility |
Comparison of EOS with BTC, ETH
Let us now compare the price movements of EOS (EOS) with that of Bitcoin (BTC), and Ethereum (ETH).
BTC Vs ETH Vs EOS Price Comparison (Source: TradingView)
From the above chart, we can interpret that the price action of EOS is similar to that of BTC and ETH. That is, when the price of BTC and ETH increases or decreases, the price of EOS also increases or decreases, respectively.
EOS (EOS) Price Prediction 2026, 2027 – 2030
With the help of the aforementioned technical analysis indicators and trend patterns, let us predict the price of EOS (EOS) in 2026, 2027, 2028, 2029, and 2030.
| Year | Bullish Price | Bearish Price |
| EOS (EOS) Price Prediction 2026 | $5 | $0.2 |
| EOS (EOS) Price Prediction 2027 | $6 | $0.1 |
| EOS (EOS) Price Prediction 2028 | $7 | $0.09 |
| EOS (EOS) Price Prediction 2029 | $8 | $0.08 |
| EOS (EOS) Price Prediction 2030 | $9 | $0.07 |
Conclusion
If EOS (EOS) establishes itself as a good investment in 2025, this year would be favorable to the cryptocurrency. In conclusion, the bullish EOS (EOS) price prediction for 2025 is $1.0397. Comparatively, if an unfavorable sentiment is triggered, the bearish EOS (EOS) price prediction for 2025 is $0.2932.
If the market momentum and investors’ sentiments positively elevate, then EOS (EOS) might hit $3. Furthermore, with future upgrades and advancements in the EOS ecosystem, EOS might surpass its current all-time high (ATH) of $22.89 and mark its new ATH.
FAQ
1. What is EOS (EOS)?
EOS is a blockchain platform designed for building decentralized applications (dApps) using a delegated proof-of-stake (DPoS) consensus mechanism.
2. Where can you purchase EOS (EOS)?
EOS (EOS) has been listed on many crypto exchanges, including Binance, Coinbase, Kraken, Bithumb, Upbit, and others.
3. Will EOS (EOS) reach a new ATH soon?
With the ongoing developments and upgrades within the EOS Platform, EOS has a high possibility of reaching its ATH soon.
4. What is the current all-time high (ATH) of EOS (EOS)?
On April 29, 2018, EOS (EOS) reached its new all-time high (ATH) of $22.89.
5. What is the lowest price of EOS (EOS)?
According to CoinMarketCap, EOS hit its all-time low (ATL) of $0.4015 on Nov 05, 2024.
6. Will EOS (EOS) reach $3?
If EOS (EOS) becomes one of the active cryptocurrencies that maintains a bullish trend, it might rally to hit $3 soon.
7. What will be EOS (EOS) price by 2026?
EOS (EOS) price is expected to reach $5 by 2026.
8. What will be EOS (EOS) price by 2027?
EOS (EOS) price is expected to reach $6 by 2027.
9. What will be EOS (EOS) price by 2028?
EOS (EOS) is expected to reach $7 by 2028.
10. What will be EOS (EOS) price by 2029?
EOS (EOS) is expected to reach $8 by 2029.
Top Crypto Predictions
Bitcoin Cash (BCH) Price Prediction
POL (ex-MATIC) Price Prediction
Conflux (CFX) Price Prediction
Disclaimer: The opinion expressed in this chart is solely the author’s. It does not represent any investment advice. TheNewsCrypto team encourages all to do their own research before investing.