- Bullish DFI price prediction ranges from $3.05 to $5.21.
- The DFI price might also reach $5.50.
- DFI bearish market price prediction for 2021 is $2.31.
In DFI price prediction 2021, we use statistics, price patterns, ADX, and much other information about DFI to analyze the future movement of the cryptocurrency.
DeFiChain is a blockchain platform that aims to bring full DeFi capabilities to the Bitcoin ecosystem. The network uses a hybrid Proof of Stake / Proof of Work consensus mechanism and leverages Bitcoin’s security by stabilising the Bitcoin blockchain every few blocks.
Current Market Status of DeFiChain (DFI)
According to Coinmarketcap, the price of DFI is $2.77 with a 24-hour trading volume of $2,487,800 at the time of writing. However, DFI dropped to 2.65% in the last 24 hours.
Moreover, DFI has a circulating supply of 300,511,840 DFI coins. Currently, DFI trades in cryptocurrency exchanges such as KuCoin, Hotbit, Bitrue, LATOKEN and Bittrex.
DeFiChain (DFI) Price Prediction 2021
DeFiChain (DFI) holds the 215th position on Coinmarketcap right now. DFI price prediction 2021 explained below with a daily time frame.
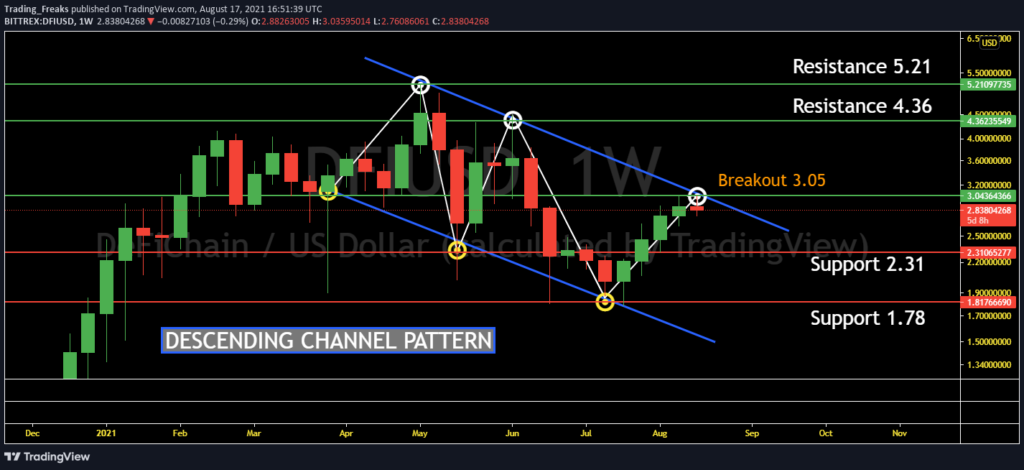
A descending channel is one type of charting pattern that technical analysts will use to analyse a security’s trend. A channel is formed by drawing trendlines along the support and resistance levels of a security’s price series. In general, channels can be used to determine the best levels of support and resistance to buy or sell securities.
Currently, DFI is trading at $2.77. After this, DFI may continue to fall or rise according to the direction of breakout. With this pattern, DFI might reach the resistance level at $5.21 soon, if the trend breaks out at $3.05. If the trend reverses, then the price of DFI may fall to $2.31.
DeFiChain (DFI) Support and Resistance Level
The below chart shows the support and resistance level of DeFiChain (DFI).
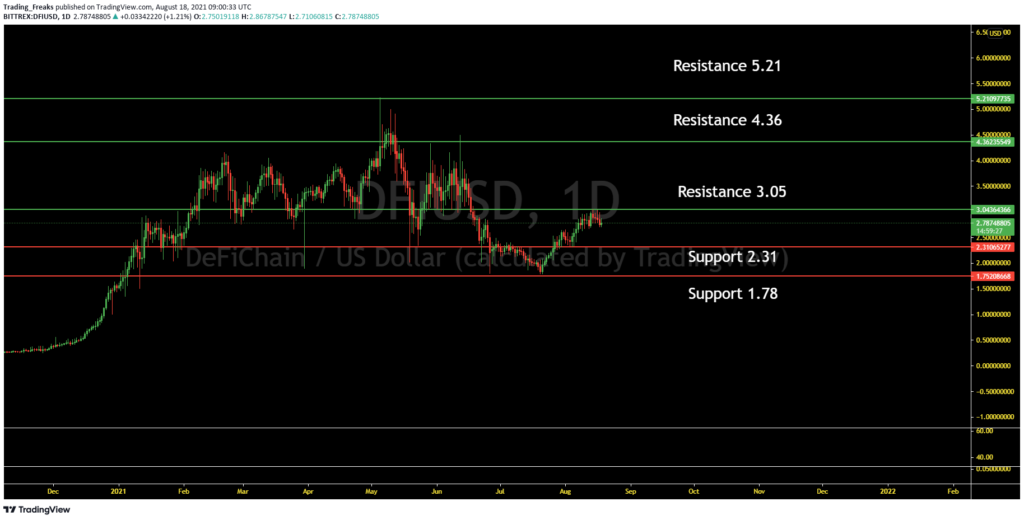
From the above chart, it is observed that the following are the resistance and support level of DFI.
- Resistance Level 1 – $3.05
- Resistance Level 2 – $4.36
- Resistance Level 3 – $5.21
- Support Level 1 – $2.31
- Support Level 2 – $1.78
The chart depicts the bearish performance of DFI over the previous month. However, this trend will continue to reach resistance level at $5.21 soon. On the contrary, if the trend reversed then DFI might fall to $2.31 presenting a bearish signal.
DeFiChain (DFI) Average Directional Index (ADX)
Let us now look at DFI’s Average Directional Index (ADX). In particular, the ADX assists traders in determining the strength of a trend rather than its direction. It can also be used to determine whether the market is changing or if a new trend is beginning. It is, however, linked to the Directional Movement Index (DMI).
Moreover, the oscillator has a range of 0 to 100. In addition, a high value represents a strong trend, while a low value represents a weak trend. Furthermore, it is frequently combined with directional indicators.
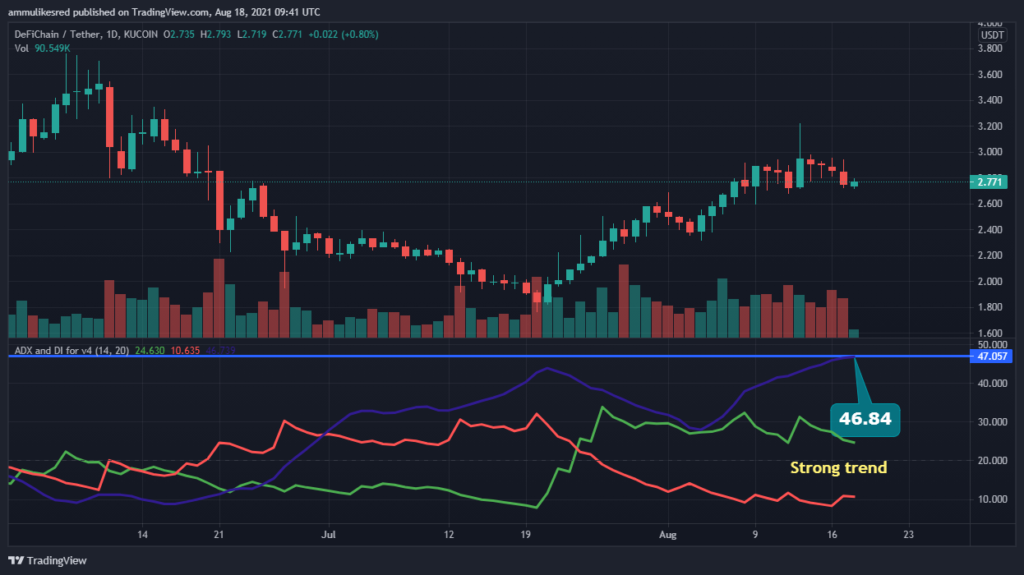
The above chart represents the ADX of DFI with the range at 46.58, so it indicates a strong trend.
Conclusion
The DFI is one of the cryptos which is great for long-term investment. In addition, DFI price prediction will be bearish or bullish, until the breakout direction is confirmed. But, it has a good chance of reaching $5.21 this year. However, this will only happen if many previous psychological barriers are broken.
Furthermore, with the advancements and upgrades on the DFI ecosystem, the performance of DFI would rise reaching $5.21 very soon. But, it might also reach $5.50 if the investors believe that DFI is a good investment in 2021.
Disclaimer: The opinion expressed in this chart solely author’s. It is not interpreted as investment advice. TheNewsCrypto team encourages all to do their own research before investing.
Recommended for You


