
- The crypto market cap dropped 7.30% to $2.9T, while trading volume surged 125% to $199B.
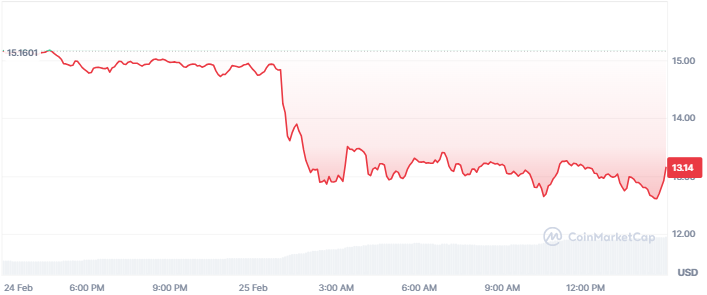
- TRUMP token fell 13% in 24 hours, trading at $13.14, with a 55% decline over 30 days.
- A trader lost $24M, swapping 763,582 TRUMP for 9.48M USDC amid the token’s continued decline.
The crypto market experienced a significant market downturn, which resulted in a 7.30% decline in the overall market cap, reaching $2.9 trillion. Despite the broad slump, the 24-hour trading volume has surged by 125% to $199 billion, indicating heightened market activity.
The bearish sentiment has seen most prices record significant declines, shedding off their recent gains. The leading asset, Bitcoin, has dropped below the $89k mark while major altcoins such as Ethereum seek support at the $2,300 level.
Amidst the broad setback, Donald Trump’s memecoin OFFICIAL TRUMP (TRUMP) was not left behind. The memecoin has continued its descending channel as the price dipped further. TRUMP is down by 82% from its all-time high of $75 set in January.
The memecoin has been trading on a steady downtrend recently, recording a decline of 55% over the past 30 days. To solidify the bearish outlook in the memecoin’s market, it has lost over 20% on the weekly chart.
As of this writing, the TRUMP token is trading at $13.14, down by 13% in the past 24 hours according to CMC data. Moreover, the bearish momentum has dropped its market cap to $2.57 billion while the trading volume gained 140%, surging to $1.52 billion.
During this market crash, a crypto trader who had benefited from trading TRUMP tokens lost about $24M in a swap. The trader traded 763,582 TRUMP for 9.48M USDC and suffered heavy losses, given the price of TRUMP was sinking.
Initially, the trader had earned $11.8M from TRUMP. Still, after investing $33.9M, the market downturn led to a significant loss, wiping out both profits and $12.6M of the trader’s initial capital.
Where is TRUMP Price Heading to?
Technical indicators on the daily chart suggest that TRUMP could drop further as the bearish momentum holds. The Moving Average Convergence Divergence (MACD) and Relative Strength Index (RSI) point to a further journey in the bearish region.
The RSI sits at 24 indexes within an oversold territory showing that sellers currently dominate market conditions. Should the current trend continue to hold TRUMP’s price, it could drop further toward the $10 mark.
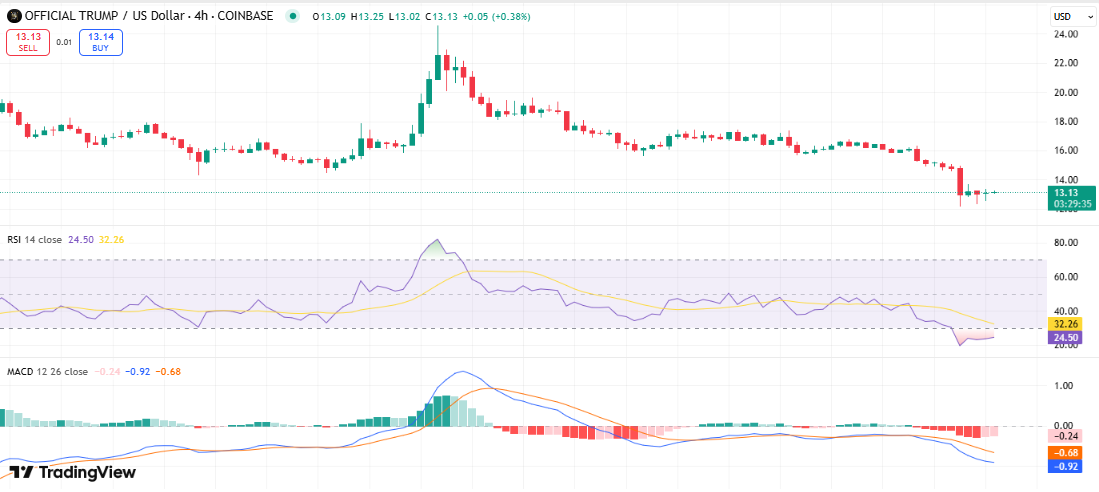
Furthermore, the MACD indicator maintains its descent below the negative threshold. The declining position of the MACD line against the signal line reinforces bearish market sentiment. The histogram maintains its pattern of printing red bars, which signals that market reversal is not around the corner.
Highlighted Crypto News Today:
PEPE Eyes Previous Support Levels as Bear Market Causes 11% Dip