
- Bitcoin price recorded a 2.38% decline in daily price movement as per CMC data.
- The cryptocurrency’ s daily trading volume surged by 67.96% in the last 24 hours.
The overall crypto market entered a slump over the weekend, after prices fell yet another time this month. Amid increased volatility, prices have been struggling to sustain bullish movements in the past few months. This has resulted in fluctuating market sentiments and an uncertainty among investors.
Notably, leading cryptocurrency, Bitcoin exhibited a 2.38% price drop over the last 24 hours and slid down to its previous resistance at $58K. This led to a price drop in other cryptocurrencies within the altcoin sector. In particular, Ethereum incurred a 5.21% drop while Solana dipped 4.34%.
On inferring the cryptocurrency’s daily price chart, the downward movement began in the Asian late evening hours of September 15. In the following day, Bitcoin hit an intraday low of $58,143. After which it showed mild upward movements and reached current trading levels. At the time of writing, Bitcoin was trading at $58,776 as per CMC data.
Moreover, on September 14, BTC price retraced back to its $60K level momentarily. This led the crypto community to expect a bull run, until however prices failed to sustain the positive momentum. Meanwhile, as aforementioned, Bitcoin fell further in the past day.
Additionally, according to Coinglass data, Bitcoin recorded $31.48 million in 24 hour liquidations. The token’s recent price drop has initiated a selling pressure within the market as it struggles to maintain a neutral sentiment among investors.
How was Bitcoin’s Performance Over the Last Week?
Bitcoin, in the past 7 days, showed intriguing price movements, with a performance of 6.58% increase. At the beginning of the week, BTC traded at a low of $54,645. As the days progressed the digital asset sparked bullish candles and climbed to a weekly high of $60,615 on September 13.
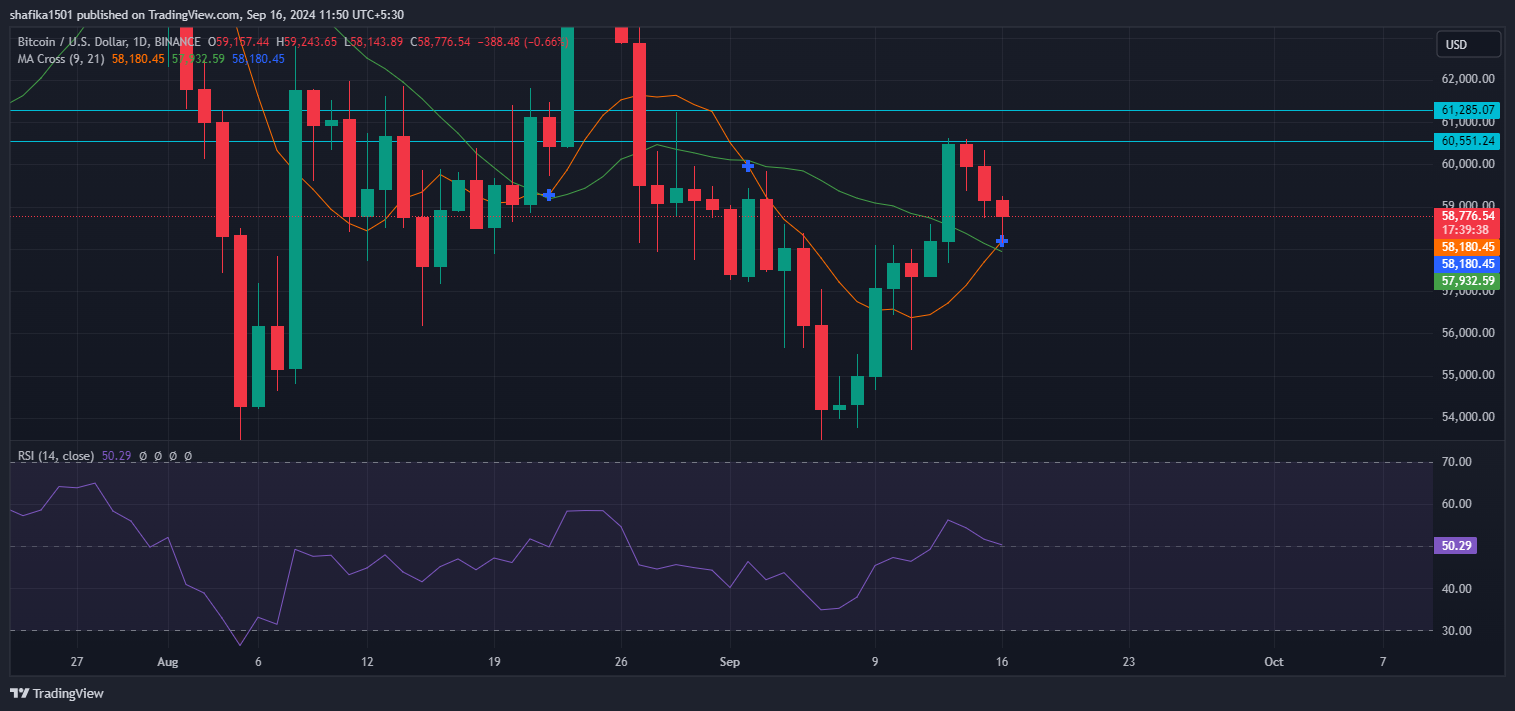
Additionally, the token’s short-term 9-day MA stands below the 21-day MA indicating the overall bearish trend as per TradingView reports. However, Bitcoin’s RSI fell to 50.29, influenced by the recent dip as investors show selling movements.
However, in the past two days, the token has receded to its previous level at $58,000. If Bitcoin manages to overpower the current bearish turn it might face resistance at $60,551 and $61,285.
Highlighted Crypto News Today:
Circle and Sony Enable USDC on Soneium Blockchain for Creators