
- Bullish TIA price prediction for 2026 is $0.814 to $1.191.
- Celestia (TIA) price might reach $10 soon.
- Bearish TIA price prediction for 2026 is $0.386.
In this Celestia (TIA) price prediction 2026, 2027-2030, we will analyze the price patterns of TIA by using accurate trader-friendly technical analysis indicators and predict the future movement of the cryptocurrency.
TABLE OF CONTENTS |
INTRODUCTION |
|
CELESTIA (TIA) PRICE PREDICTION 2026 |
|
| CELESTIA (TIA) PRICE PREDICTION 2027, 2028-2030 |
| CONCLUSION |
| FAQ |
Celestia (TIA) Current Market Status
| Current Price | $0.5065 | 24 – Hour Price Change | 3.81% Up |
| 24 – Hour Trading Volume | $44.12M |
| Market Cap | $435.92M |
| Circulating Supply | 861.78M TIA | All – Time High | $20.91 (On Feb 10, 2024) |
| All – Time Low | $0.3166 (On Oct 11, 2025) |
What is Celestia (TIA)
| TICKER | TIA |
| BLOCKCHAIN | Celestia |
| CATEGORY | Modular Blockchain Network |
| LAUNCHED ON | 31 October 2023 |
| UTILITIES | Governance, tipping system, gas fees & rewards |
Celestia stands as an innovative cryptocurrency venture, concentrating on constructing a modular consensus and data availability layer. This framework forms a distinctive base for decentralized applications, fostering heightened efficiency and security. Notably, Celestia separates consensus from execution, resulting in improved scalability and adaptability for blockchain development.
Functioning as a modular blockchain network, Celestia provides developers with the essential infrastructure for constructing and sustaining blockchains. Its versatility is showcased as other blockchains can utilize Celestia as a data availability and consensus layer. In the role of a data availability layer, Celestia permits secure publication of transactions, ensuring the streamlined operation of nodes on expanding blockchains. As a consensus layer, Celestia’s network of nodes verifies and authenticates stored data.
Celestia introduced its native cryptocurrency, TIA, concurrently with its main net launch on October 31, 2024. TIA is integral for developers, serving as fees for Celestia’s data availability solutions, gas tokens for Celestia-based rollups, and staking in this proof-of-stake chain.
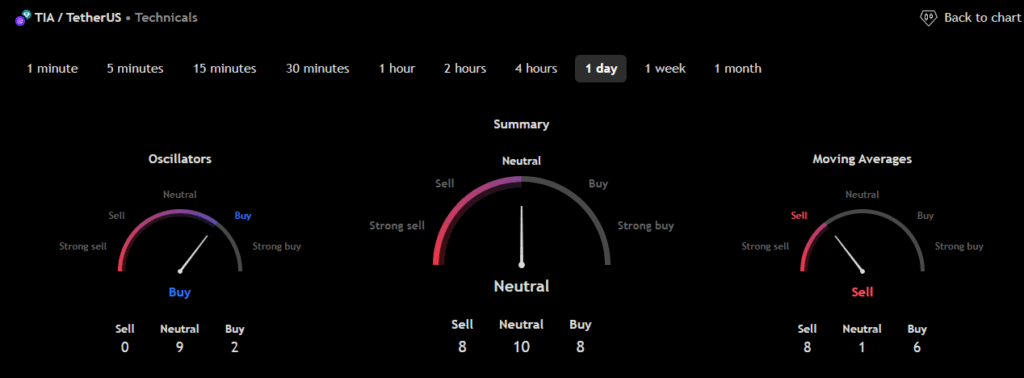
Celestia 24H Technicals
Celestia (TIA) Price Prediction 2026
Celestia (TIA) ranks 98th on CoinMarketCap in terms of its market capitalization. The overview of the Celestia price prediction for 2026 is explained below with a daily time frame.
In the above chart, Celestia (TIA) laid out the Descending Channel pattern. A descending channel, also known as a falling channel, is a bearish technical analysis pattern formed by two parallel downward-sloping trendlines. The upper trendline connects a series of high points, indicating resistance where the price struggles to rise above, while the lower trendline connects the lower points, acting as support.
This pattern suggests that sellers are in control, with the price consistently making lower highs and lower lows. Traders often look to sell near the upper trendline and buy near the lower trendline, as the price typically oscillates within this defined range. Overall, the descending channel helps traders identify potential shorting opportunities and assess market sentiment.
At the time of analysis, the price of Celestia (TIA) was recorded at $0.5065. If the pattern trend continues, then the price of TIA might reach the resistance levels of $0.719, $1.089 and $1.564. If the trend reverses, then the price of TIA may fall to the support level of $0.554.
Celestia (TIA) Resistance and Support Levels
The chart given below elucidates the possible resistance and support levels of Celestia (TIA) in 2026.
From the above chart, we can analyze and identify the following as resistance and support levels of Celestia (TIA) for 2026.
| Resistance Level 1 | $0.814 |
| Resistance Level 2 | $1.191 |
| Support Level 1 | $0.559 |
| Support Level 2 | $0.386 |
TIA Resistance & Support Levels
Celestia (TIA) Price Prediction 2026 — RVOL, MA, and RSI
The technical analysis indicators such as Relative Volume (RVOL), Moving Average (MA), and Relative Strength Index (RSI) of Celestia (TIA) are shown in the chart below.
From the readings on the chart above, we can make the following inferences regarding the current Celestia (TIA) market in 2026.
| INDICATOR | PURPOSE | READING | INFERENCE |
| 50-Day Moving Average (50MA) | Nature of the current trend by comparing the average price over 50 days | 50 MA = $0.7983Price = $0.6092 (50MA > Price) | Bearish/Downtrend |
| Relative Strength Index (RSI) | Magnitude of price change;Analyzing oversold & overbought conditions | 41.5730 <30 = Oversold 50-70 = Neutral>70 = Overbought | Nearly Oversold |
| Relative Volume (RVOL) | Asset’s trading volume in relation to its recent average volumes | Below cutoff line | Weak volume |
Celestia (TIA) Price Prediction 2026 — ADX, RVI
In the below chart, we analyze the strength and volatility of Celestia (TIA) using the following technical analysis indicators — Average Directional Index (ADX) and Relative Volatility Index (RVI).
From the readings on the chart above, we can make the following inferences regarding the price momentum of Celestia (TIA).
| INDICATOR | PURPOSE | READING | INFERENCE |
| Average Directional Index (ADX) | Strength of the trend momentum | 25.7024 | Strong Trend |
| Relative Volatility Index (RVI) | Volatility over a specific period | 41.71 <50 = Low >50 = High | Low volatility |
Comparison of TIA with BTC, ETH
Let us now compare the price movements of Celestia (TIA) with that of Bitcoin (BTC), and Ethereum (ETH).
From the above chart, we can interpret that the price action of TIA is similar to that of BTC and ETH. That is, when the price of BTC and ETH increases or decreases, the price of TIA also increases or decreases, respectively.
Celestia (TIA) Price Prediction 2027, 2028 – 2030
With the help of the aforementioned technical analysis indicators and trend patterns, let us predict the price of Celestia (TIA) between 2027, 2028, 2029, and 2030.
| Year | Bullish Price | Bearish Price |
| Celestia (TIA) Price Prediction 2027 | $15 | $0.3 |
| Celestia (TIA) Price Prediction 2028 | $20 | $0.2 |
| Celestia (TIA) Price Prediction 2029 | $25 | $0.1 |
| Celestia (TIA) Price Prediction 2030 | $30 | $0.09 |
Conclusion
If Celestia (TIA) establishes itself as a good investment in 2026, this year would be favorable to the cryptocurrency. In conclusion, the bullish Celestia (TIA) price prediction for 2026 is $1.191. Comparatively, if unfavorable sentiment is triggered, the bearish Celestia (TIA) price prediction for 2026 is $0.386.
If the market momentum and investors’ sentiment positively elevate, then Celestia (TIA) might hit $10. Furthermore, with future upgrades and advancements in the Celestia ecosystem, TIA might surpass its current all-time high (ATH) of $20.91 and mark its new ATH.
FAQ
1. What is Celestia (TIA)?
Celestia stands as an innovative cryptocurrency venture that concentrates on constructing a modular consensus and data availability layer.
2. Where can you purchase Celestia (TIA)?
Traders can trade Celestia (TIA) on cryptocurrency exchanges such as Binance, Bybit, OKX, DigiFinex, and BingX.
3. Will Celestia (TIA) reach a new ATH soon?
With the ongoing developments and upgrades within the Celestia platform, Celestia (TIA) has a high possibility of reaching its ATH soon.
4. What is the current all-time high (ATH) of Celestia (TIA)?
Celestia (TIA) hit its current all-time high (ATH) of $20.91 on February 10, 2024.
5. What is the lowest price of Celestia (TIA)?
According to CoinMarketCap, TIA hit its all-time low (ATL) of $0.3166 on October 11, 2025.
6. Will Celestia (TIA) reach $10?
If Celestia (TIA) becomes one of the active cryptocurrencies that majorly maintain a bullish trend, it might rally to hit $10 soon.
7. What will be Celestia (TIA) price by 2027?
Celestia (TIA) price is expected to reach $15 by 2027.
8. What will be Celestia (TIA) price by 2028?
Celestia (TIA) price is expected to reach $20 by 2028.
9. What will be Celestia (TIA) price by 2029?
Celestia (TIA) price is expected to reach $25 by 2029.
10. What will be Celestia (TIA) price by 2030?
Celestia (TIA) price is expected to reach $30 by 2030.
Top Crypto Predictions
Chainlink (LINK) Price Prediction
Router Protocol (ROUTE) Price Prediction
Hedera (HBAR) Price Prediction
Disclaimer: The opinion expressed in this chart is solely the author’s. It does not represent any investment advice. TheNewsCrypto team encourages all to do their own research before investing.