

- TIA price analysis for March is bullish with potential new highs if it breaks the $5.442 hurdle.
- Indicators suggest reliable momentum and a possible golden crossover.
TIA price analysis for March is bullish and suggests new highs, which may be visible in the upcoming days. However, the price will gain momentum when it succeeds in breaking out of the $5.442 hurdle.
Celestia price is in a recovery phase and bulls are trying their best to hold the recent gains. The buying activity is increasing and the price is also following the same direction. It demonstrates that the buying momentum is reliable and buyers are accumulating the TIA at a lower price.
On the daily technical chart, the Celestia price breaks above the 50-day EMA level and now heading toward the 200-day EMA mark. If it breaks the 200-day EMA level then more participation of the investors might be visible.
On the 4-hour timeframe, the TIA price breaks above the 50-day and 200-day EMA level and might show a golden crossover. If the crossover happens, then investors may witness a fresh upside bullish rally.
The breakout above both the EMAs showcased the uptrend and confidence of the bulls. The recent recovery looks reliable so the price is likely to hold the bullish momentum.
Will TIA Crypto Price Break 200 EMA Mark?
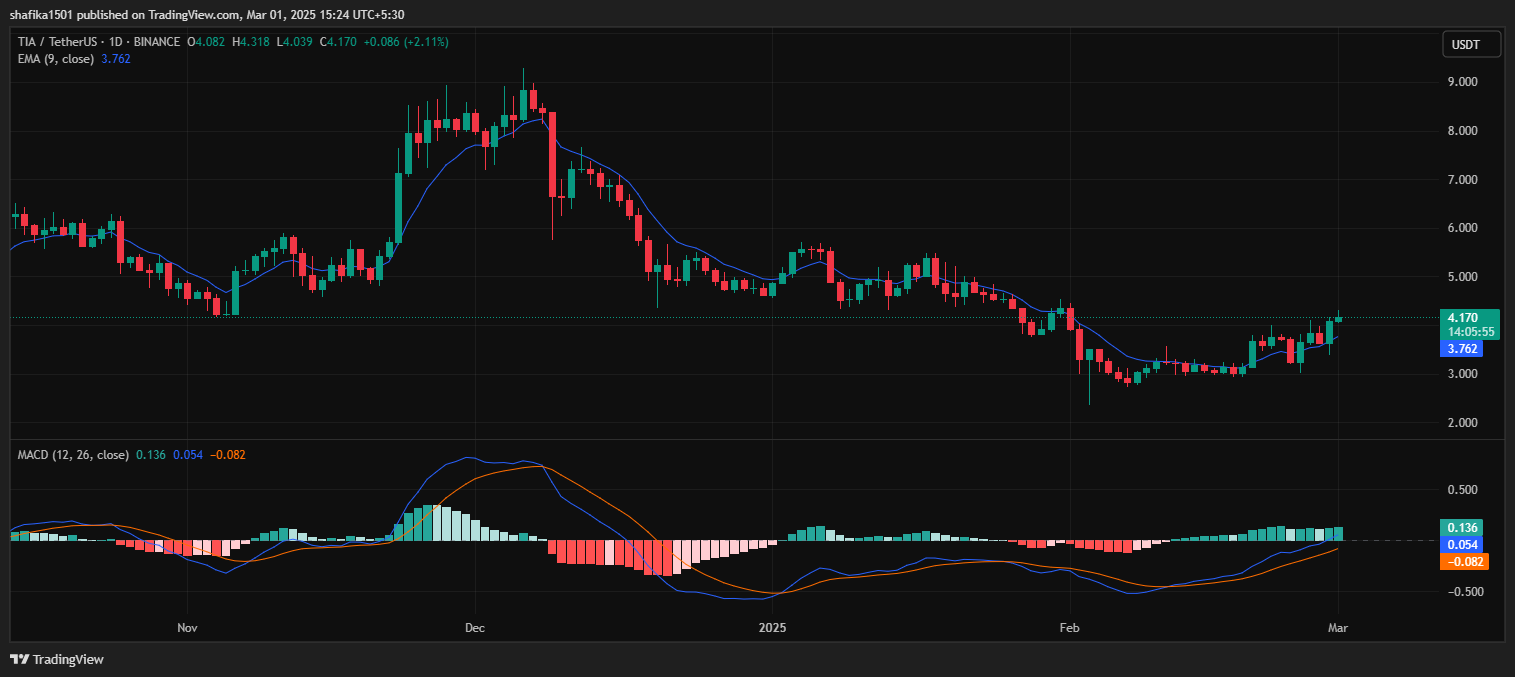
The indicators are also showcasing bullish momentum in the TIA price. MACD is heading in an upward direction with a green histogram. MACD curve breaks above the median line showcasing bullishness. RSI is at 59.30 heading upside suggesting bullishness.
According to CoinMarketCap data, currently, the TIA crypto price is trading at $4.170 with an intraday surge of 24%. The 24-hour trading volume is $230.67 million and the market cap stands at $2.29 billion. Furthermore, the community sentiment is 81% bullish and 19% bearish.
Additionally, the trading view technical summary also supports the bulls. As per the technical summary, out of 26 indicators 6 are on the sell side, 9 are on the neutral side and 11 are on the buying side, suggesting buying momentum.
TIA price analysis for March is bullish and suggests that buyers will lead the upcoming rally. In upcoming months, if the bulls succeed in breaking out of the $5.4 hurdle, then a fresh rally may be visible.
Highlighted Crypto News Today:
THORChain Dev Quits Over Reversal of Vote to Halt Stolen Crypto