- ADA price up 13.40% in past week despite 37% YTD drop.
- EMA crossover and MVRV ratio suggest potential for a significant rally.
- Technical analysis points to a possible 500% gain, targeting $2.40 in six months.
Cardano (ADA) finds itself at a critical juncture as it emerges from a prolonged downtrend, with recent price action hinting at the possibility of a sustained rally. Despite a year-to-date decline of approximately 37%, ADA has surged 13.40% in the past week, igniting speculation about a potential long-term uptrend.
The weekly chart reveals intriguing parallels between Cardano’s current market position and its setup prior to the monumental rally of December 2020 to May 2021.
During that period, ADA skyrocketed from $0.15 to $1.77, registering an astounding 1041% gain. This historic surge was precipitated by a bullish signal when the 50-day Exponential Moving Average (EMA) crossed above the 100-day EMA.
Presently, with ADA trading at $0.39, a similar EMA alignment is taking shape, mirroring the configuration that preceded its previous bull run. This technical setup, coupled with ADA’s position within a descending triangle pattern, suggests the potential for a significant breakout.
Can Cardano surge 500%?
Should Cardano successfully breach the upper boundary of its descending channel, historical patterns indicate the possibility of a 500% price appreciation over the next six months. Such a move would catapult ADA towards the $2.40 mark, representing a substantial recovery from current levels.
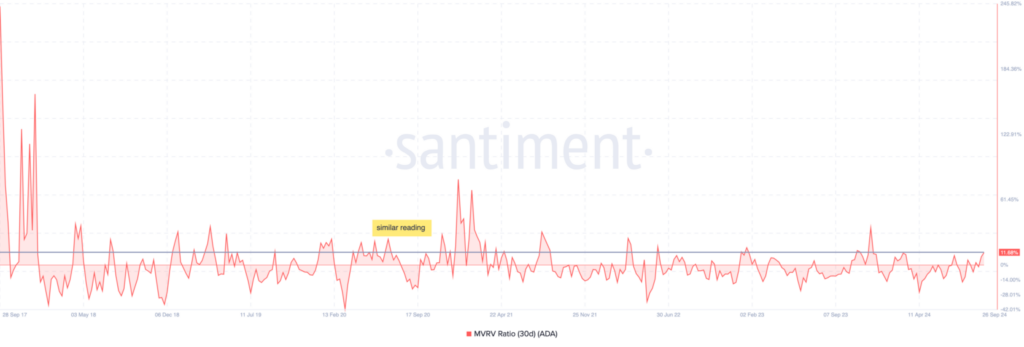
Further bolstering the bullish case, Cardano’s 30-day Market Value to Realized Value (MVRV) ratio currently stands at 11.95%.
This reading, identical to that observed in December 2020, suggests a balanced market where profitability exists but selling pressure remains subdued. Historically, such MVRV levels have preceded periods of significant price appreciation.
The ADA/USD 3-day chart offers additional support for the optimistic outlook. The Relative Strength Index (RSI) has recently breached the neutral midpoint, signaling growing bullish momentum. This technical development bears striking similarities to the pattern observed during ADA’s move from $0.47 to $0.75 earlier in the year.