


- Solana trades at $140, marking an increase by 13.56% over the last 24 hours.
- $483M worth of SOL were transferred to Binance and Coinbase.
Bitcoin (BTC) and Ethereum (ETH), the largest cryptocurrencies by market cap, have faced a critical and dramatic downturn that panicked the global crypto community. In the unforeseen market crash, BTC plummeted by 17%, hitting its 5-month-low at $49K. Likewise, ETH recorded a severe drop of 24%, priced below the $2.5K mark.
The impact of the total declines resulted in a staggering $1.04 billion worth of liquidations over the past 24 hours, pushing the global market cap below $2 trillion for the first time since February.
Dramatically, after yesterday’s unexpected downturn, the global crypto market has started the day with a brief spike in prices. The altcoin Solana (SOL) was not spared in the market crash. The asset has dropped below $115, losing over 21%. Currently, the asset is up by 13.56%.
According to Whale Alert data, the crash fear led to a significant transfer of 3.13 million SOL worth around $483 million to exchanges such as Binance and Coinbase within the last 24 hours.
Over the past 24 hours, the token has been trading at a 5-month low of $110.61, gradually showing price hikes. At the time of writing, SOL was trading at a price of $140 with a market cap of $65 billion. Meanwhile, Solana’s trading volume exhibited a 73.44% increase and stayed at $12.26 billion, as per CoinMarketCap data.
Can the Bulls Dominate SOL Soon?
Over the last seven days, Solana has shown a declining price movement of 23.09%. At the beginning of the week, SOL was trading at a high of $182. The token’s price dived in the following days to $111.
The daily relative strength index (RSI) is 41.75, as per TradingView data, which hints the asset is approaching the neutral zone. The moving averages lying above the current price action, 9-day MA and 21-day MA noted at $156 and $166 respectively, indicate a bearish trend.
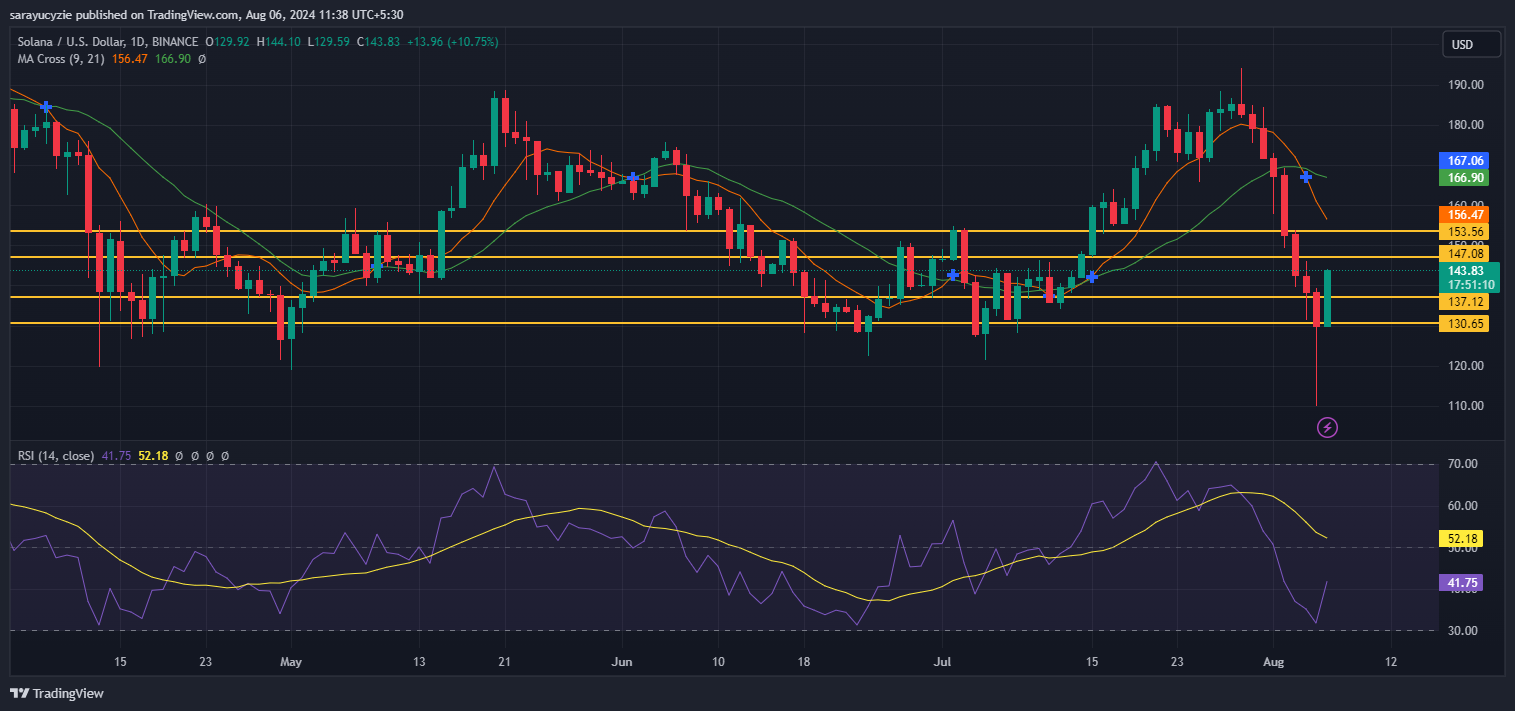
Moreover, if a recovery occurs, SOL can test its initial resistance at the $147 level. If the bullish momentum persists, the token might surge to face the subsequent resistance range between the $151.26 and $155.69. However, if the bears take over, the token might dive to find its major support at $137.12. Further losses might take the price to the $130 level.
Disclaimer: The opinion expressed here is solely the author’s. It does not represent investment advice. TheNewsCrypto team encourages everyone to do their own research before investing.
Highlighted Crypto News
Is Bitcoin Aiming For Price Recovery Amid Mounting SellOffs?