
- Hyperliquid has recorded a loss of over 7%, trading at $22.
- HYPE’s daily trading volume has increased by 44%.
As bearish pressure grips the crypto market, Bitcoin and Ethereum stall at resistance. The altcoin Hyperliquid (HYPE) followed suit and landed among the top losers, taking a sharp 7.84% hit.
HYPE’s crucial resistance levels at $32.27 and $35 are to be tested to confirm the breach of its ATH. With the bull support, the altcoin can eye more upside. Hyperliquid opened the day trading at a high of $24.81, and the bears pulled it back to a low of $22.32 mark.
At the time of writing, the altcoin traded at $22.90, with its market cap reaching $7.65 billion. Notably, the daily trading volume of HYPE has increased by over 44.75%, resting at $326 million.
In addition, HyperLiquid has invited attention with the launch of HyperEVM and its bug bounty program to upgrade platform stability and security. It provides considerable rewards for developers who identify the vulnerabilities within the system.
Does HYPE Have More Downside Ahead?
Assuming the in-progress downside momentum continues, Hyperliquid could descend toward the $17 range. In the case of the HYPE market turning highly bearish with sturdy selling pressure, the price might plunge to its former lows.
In defiance, if the downtrend reverses, the asset could climb to its immediate resistance at $27.74. If the upside correction persists, a steady surge in price might likely push the asset to a high above its all-time high set two months ago.
The Moving Average Convergence Divergence (MACD) line and the signal line are located below the zero line. It confirms a strong bearish crossover in the market. Traders interpret this to avoid long positions or consider shorting opportunities.
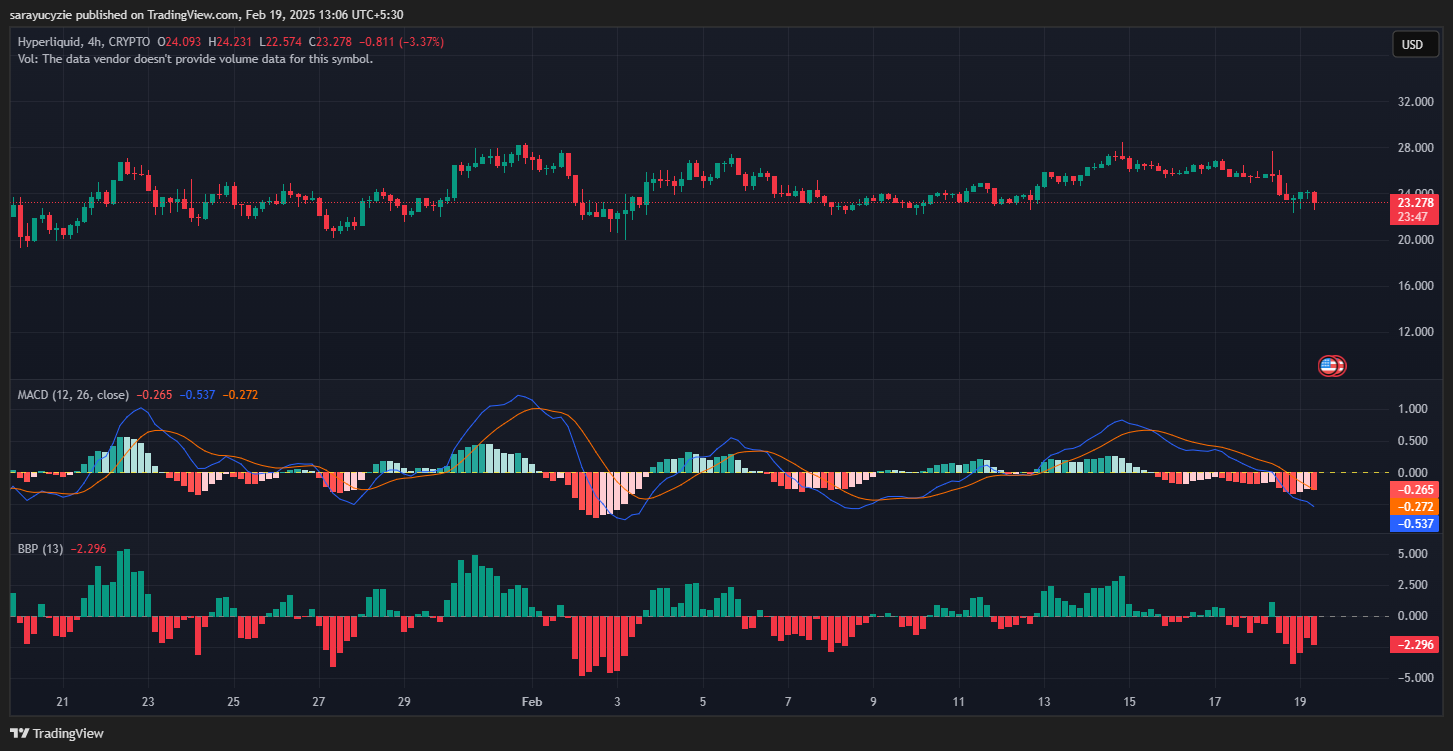
Besides, the Bull Bear Power (BBP) indicator at -2.296 suggests that bears are in control, pushing prices lower. The more negative the value, the stronger the bearish momentum. This signals a potential weakness in price action.
Moreover, the daily frame of Hyperliquid displays the daily relative strength index (RSI) of 46.29 pointing out the neutral to slightly bearish momentum. The short-term 9-day moving average is found above the long-term 21-day moving average.
Disclaimer: The opinion expressed in this article is solely the author’s. It does not represent any investment advice. TheNewsCrypto team encourages all to do their own research before investing.
Highlighted Crypto News
Howard Lutnick Takes Charge as the 41st U.S. Commerce Secretary