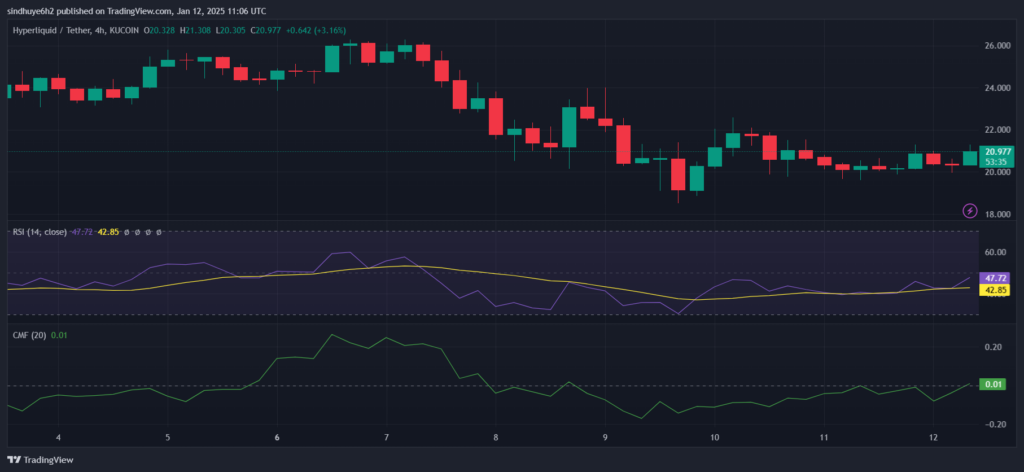
- Hyperliquid (HYPE) rose 4.85% to $20.98, with a market cap of $7.01B.
- RSI at 42.85 signals mild bearish momentum, with CMF showing modest inflows.
Hyperliquid (HYPE) touched an intraday high of $21.22 before settling at $20.98. The price reflects a 5.03% gain over the last 24 hours. The trading volume surged 42.31% to $94.1 million, indicating heightened market activity.
Hyperliquid’s Market Cap ratio of 1.34% underscores significant trading activity relative to its market size. The recent integration into ElizaOS version 0.1.8, which supports Hyperliquid and other networks, highlights increasing adoption. This development could further bolster HYPE’s position as a promising crypto asset.
Technical Indicators Signal Consolidation
The trading chart shows key resistance at $21.30 and support at $20.30. Breaking above $21.30 could propel the price toward $22.00 while losing the $20.30 support might push it down to $19.50. The Relative Strength Index (RSI) is at 42.85, trailing the 14-period average of 47.72. This suggests mild bearish momentum.

The Chaikin Money Flow (CMF) at 0.01 indicates modest capital inflows into HYPE, signaling limited buying pressure. Moving averages reveal the 20-day EMA trending below the 50-day EMA, implying continued consolidation. The absence of a bullish moving average crossover suggests the current trend may persist.
If HYPE surpasses $21.30, it may climb to $22.00, representing a 5% increase. However, failing to hold above $20.30 could lead to a decline toward $19.50. The RSI and moving averages suggest caution in the near term, but long-term prospects remain positive.
Highlighted Crypto News Today
Investor Sentiment on Edge Ahead of US CPI and PPI Inflation Data


