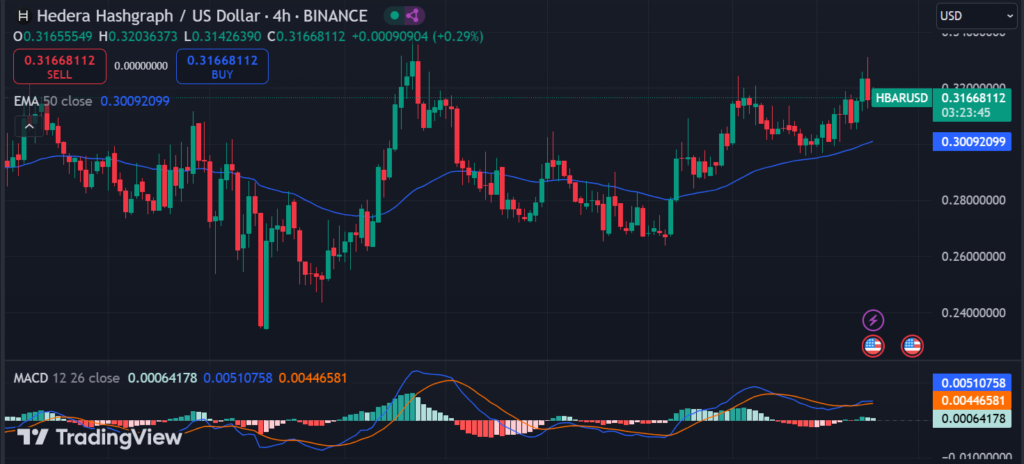
- HBAR price has surged 10% in 24 hours, becoming a top gainer in the crypto market.
- Hedera rose from $0.3008 to $0.3295 with a 102% rise in trading volume.
The 2025 bull run has officially started with Bitcoin once again trading above $101K. While the BTC rally has triggered optimism in the market, altcoins are showing incredible performance.
Amid the 1-3% increase in the 24-hour charts of leading altcoins like Solana (SOL) and XRP, Hedera’s native cryptocurrency, HBAR, has climbed about 10% in the last 24 hours, topping the gainers list.
Today, HBAR’s price surged from $0.3008 to an intraday high of $0.3295 within a single day, before slightly sliding back to $0.3199 at the time of writing. Despite this slight pullback, the altcoin boasts a market cap of $12.23 billion and has seen its trading volume soar by more than 102% to $925 million.
Zooming in, over the week, HBAR has surged 17%, and seen an impressive 296% rally in the past year. However, it remains 5% below its monthly high, which was above $0.3312.
With these strong gains and the current market optimism, the big question is whether Hedera can break its all-time high of $0.5701 during this altcoin season.
HBAR 24-H Technical Analysis: Key Price Levels
Looking at the technical overview, HBAR’s chart suggests further bullish momentum. On the day chart, the altcoin has formed a bull flag pattern. A bull flag pattern starts with a steep, nearly vertical price surge—referred to as the flagpole—driven by buyers overwhelming sellers.

This is supported by key indicators like the Exponential Moving Average. A “death cross” occurs with EMA below HBAR’s price, suggesting bullish momentum and an upward trend.
Additionally, a CMF value of 0.08 indicates mild buying pressure in the market. To validate this, the RSI of 58 indicates a neutral to slightly bullish outlook, while the MACD suggests a continuation of the bullish trend.
Based on the above technical analysis, key resistance and support levels have been identified as follows:
- Short-term target: Around $0.35 — A possible resistance level based on prior price action.
- Medium-term target: Reach $0.40 if the bullish trend strengthens.
- Support Level 1: $0.30 — This level has been a recent low and could act as a strong support zone.
- Support Level 2: $0.28 — Another potential support if the price continues to drop, as it’s a key previous level where the price bounced.
Highlighted Crypto News Today
Do Kwon’s Terra Crash Millions Affected and Legal Fights Continue


