
- Cardano records a gain of over 17%, trading at $0.7574.
- ADA’s technical indicators reveal conflicting trends.
Following a sharp downturn after Trump’s new tariffs, the crypto market has bounced back. The largest asset, Bitcoin (BTC), has risen to $102K, while Cardano (ADA) has gained over 17.63% in the last 24 hours.
Despite this short-term recovery, ADA’s momentum remains uncertain, with technical indicators exhibiting ambiguous signals. In the early hours, Cardano traded at $0.6718 and eventually mounted to a high of $0.823.
As of the current time, Cardano trades at $0.7574, with its daily trading volume reaching $2.8 billion, as per CMC data. Notably, the market has witnessed a $6.34 million ADA liquidation during the period.
Cardano’s price has seen a sharp 21.56% decline in the last seven days as the market struggles with volatility. ADA hit a weekly low of $0.6111 from a high of $0.9849. However, the bears prevented the asset from sliding deeper below $0.50.
Will ADA Enter an Uptrend?
Cardano’s Moving Average Convergence Divergence (MACD) line and signal line are positioned below the zero line. It indicates a strong bearish trend. However, if the MACD crosses above the signal line while still below zero, signals the signs of a potential reversal.
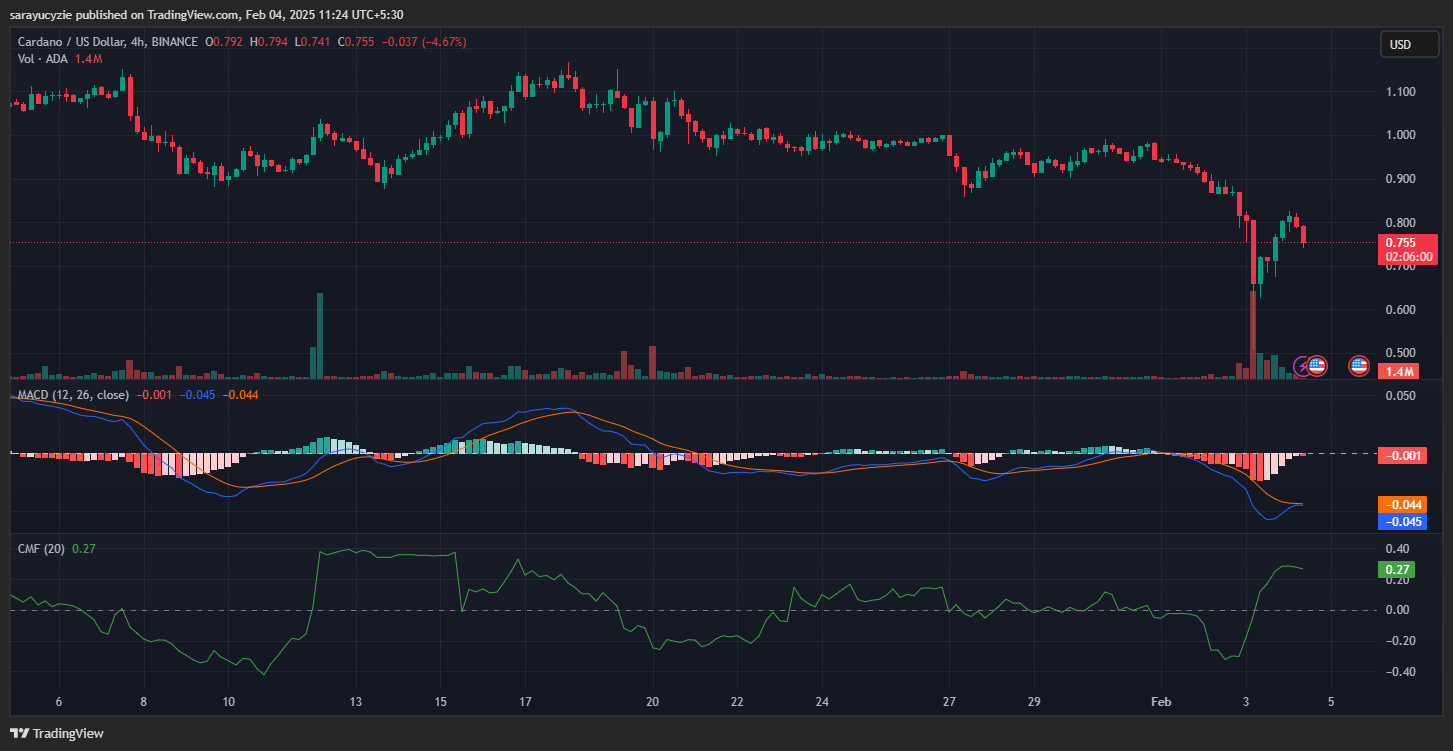
In addition, the Chaikin Money Flow (CMF) indicator, at 0.27, suggests strong buying pressure, with money flowing into the asset. Significantly, the daily trading volume of Cardano has decreased by over 16.13%.
The four-hour candlestick chart of ADA unveils the in-progress negative correction. If the current momentum aggravates, the nearby support could be tested at $0.7391. A loss of this level may open the door to more downside, dropping to $0.67.
On the flip side, assuming the reversal of ADA and the formation of a golden cross would strengthen the upside price action. Cardano’s price could likely retest the $0.7811 resistance. An extended gain of the asset might potentially push the price to the $0.8316 mark.
Moreover, ADA is in a neutral to slightly bearish zone, with the daily relative strength index (RSI) staying at 40.41. If the RSI drops, it may signal further selling. Besides, the short-term 9-day MA is located beneath the long-term 21-day MA.
Disclaimer: The opinion expressed in this article is solely the author’s. It does not represent any investment advice. TheNewsCrypto team encourages all to do their own research before investing.