- Bitcoin price has rebounded 4%, nearing the $59,500 mark in the recent recovery.
- Bitcoin ETFs in the US saw $216.33 million in net inflows, marking three consecutive days of positive investment.
Despite the German government and Mt. Gox selling pressures, the global crypto market displayed a notable rebound, driven by Bitcoin’s (BTC) recovery on July 10. This upward movement comes in the wake of recent market turbulence, as Bitcoin climbed nearly 4.20% to approach the $59,500 zone.
At the time of writing, Bitcoin is trading at $59,201, with a market cap of $1.16 trillion. This recovery represents a climb from a recent low of $54,424, which was recorded on July 8. However, Bitcoin’s daily trading volume has decreased by approximately 20%, settling at around $28 billion.
In parallel, the 11 spot Bitcoin exchange-traded funds (ETFs) in the U.S. have seen solid inflows. On Tuesday alone. These ETFs recorded net inflows of $216.33 million, marking the third consecutive day of positive investment activity.
Is Bitcoin Targeting a Recovery?
Bitcoin’s price movement remains unclear as it has fluctuated between the $53,000 and $60,000 range over the past week. There is speculation that Bitcoin could gain further bullish momentum if it successfully breaches the $60,000 resistance zone.
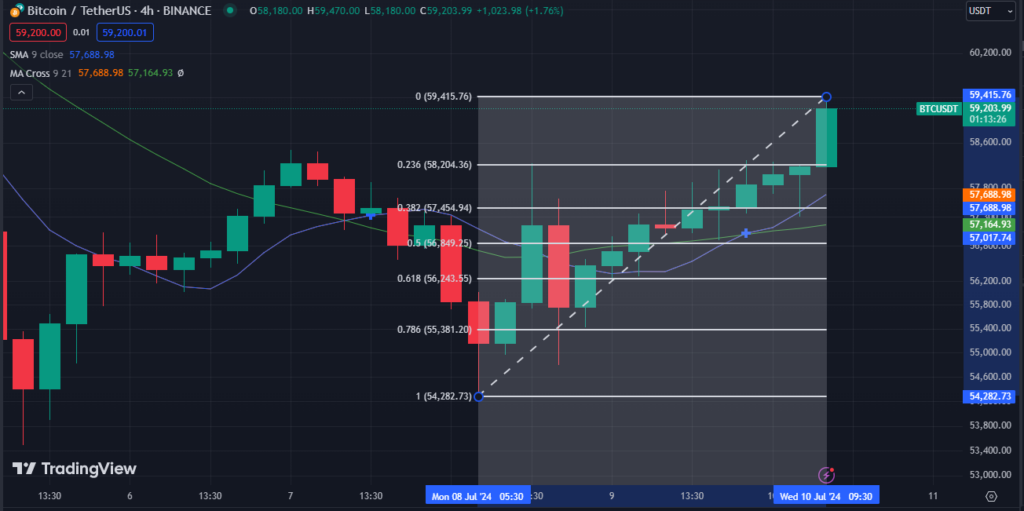
Following a recovery above $59,000, Bitcoin even surpassed the $59,400 level. Further, BTC has tested the 23.6% Fibonacci retracement level from a low of $54,282 to a high of $59,415, with bullish activity evident above the $58,500 level. Also, the BTC price is above the 9-day moving average (MA), indicating bullish momentum and potential for further upward movement.

However, the bear around the $59,500 mark remains strong. After reaching a high of $59,415, Bitcoin’s price has entered a consolidation phase. Currently, Bitcoin is trading at $59,201, remaining above its 100-hourly simple moving average. Also, a bullish trend line is forming, providing strong support at the $59,000 level on the hourly chart of the BTC/USD pair. Immediate resistance is observed near the $59,800 mark.
The first significant resistance is at $59,600. According to the BTC price prediction, a decisive move above this level could trigger a further increase and drive the price toward the next major resistance at $60,200. If Bitcoin manages to close above this point, more gains may push the price to test the $60,800 resistance. However, continued upward movement could be challenging.
Conversely, if Bitcoin fails to overcome the $59,500 resistance, it might face another decline. Immediate support on the downside is near $58,800. The first major support is at $58,750. Further support is found around $57,500, aligned with the 61.8% Fibonacci retracement level of $56,243 to the high of $57,454. Any additional losses could drive the price to the $55,000 support zone in the short term.


