
- Bitcoin price enters $54.8K after a brief gain of 0.62% in the last 24 hours.
- Some crypto analysts anticipate the occurrence of BTC’s historical post-halving rallies.
The September Effect plays a vital role in the crypto market. Historically, this month has been difficult for U.S. stocks and the Bitcoin market. Over the past few weeks, BTC has defied all bullish market predictions, extending its bearish rally to date.
Bitcoin touched the $64K mark in late August, ascending from a low of $56K. However, in September, this largest cryptocurrency by market cap underwent an 18% decline. This downturn heightened the selling pressure.
Notably, Bitcoin plunged to a one-month low of around $52K on September 6, bringing a strong bearish wave to the cryptocurrency market.
Over the last 24 hours, the BTC price recorded a mild gain of 0.62%. But after hitting a peak of $55,373, it plummeted to $53,653, indicating a prolonged bear rally. At the time of writing, BTC traded at $54,883, with its daily trading volume increasing by 21% to $21.64 billion, as per CMC data. Consequently, BTC continues to stay in the fear zone as the Fear and Greed Index stays at 26.
As per the crypto analyst, the current BTC market cycles appear to mirror both the 2016 and 2020 halving. That is, Bitcoin reached its bottom roughly 517-547 days before the halving. While the bull market top occurred around 518–549 days after the halving.
If this pattern holds, Bitcoin’s 2024 halving could have bottomed the price 517 days prior; the bull market may peak approximately 549 days post-halving, a potential high around October 2025.
What’s Ahead for BTC?
The downward trajectory of BTC has continued over the past month and week. In the last thirty days, the asset lost over 8.80%. However, this bear hold’s impact was reflected on the weekly chart that displayed a 4.60% drop, from $57.6K to $52.7K.
The technical indicators of BTC suggest the asset failed to overcome the bearish trend. The short-term 50-day and the long-term 200-day moving averages are found above the current price momentum. Moreover, the asset is approaching the neutral zone in the market, as the daily relative strength index (RSI) stands at 44.65.
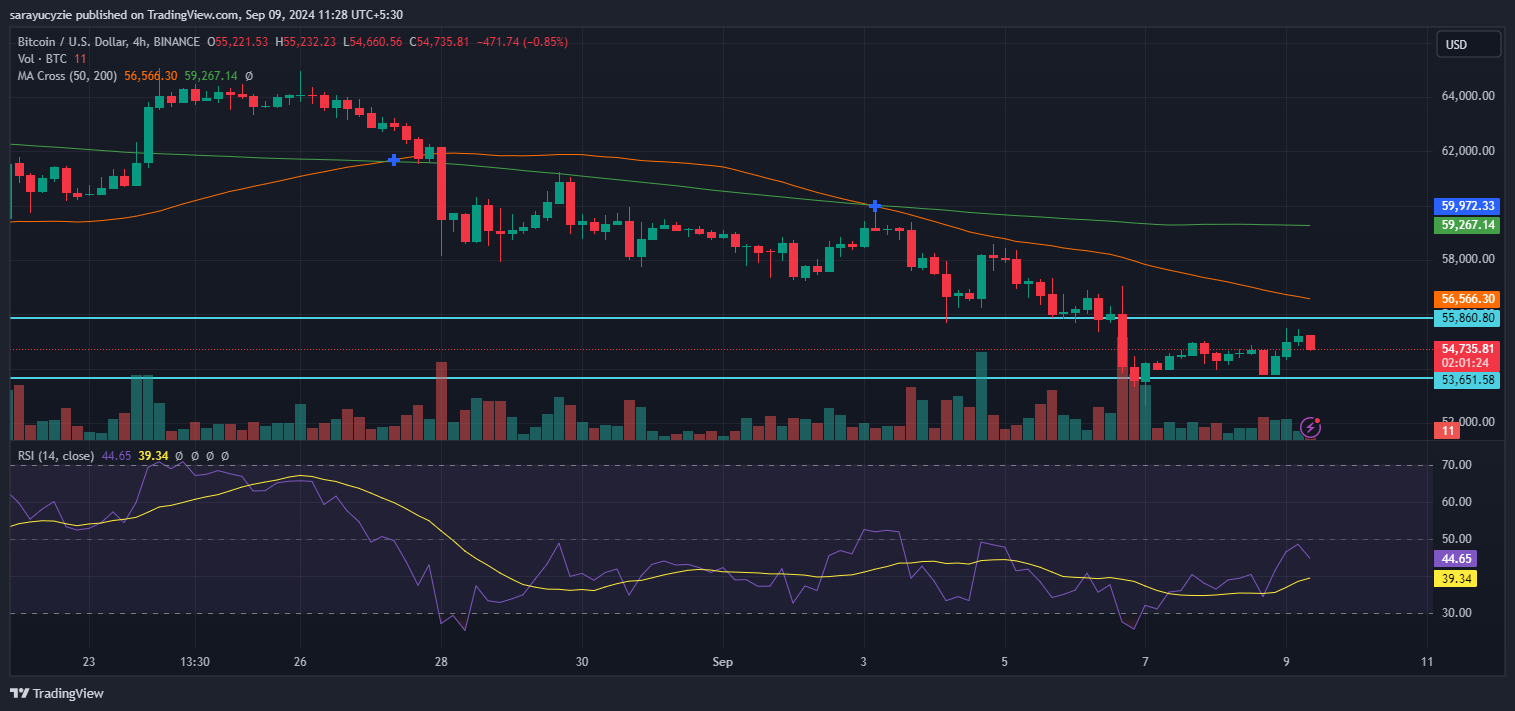
At press time, Bitcoin’s price oscillates between $54,000 and $55,000. Breaking past the $60K mark might signal the bull cycle. BTC may test the initial resistance at the $55,860 level, a crucial area for bulls. A rebound from this level allows BTC to recover, but losing it could push the price toward $53,651 support.