



- Bitcoin ETFs saw $526.64 million in net outflows.
- BTC is currently trading at around the $63.1K mark.
U.S. spot Bitcoin ETFs have posted $526.64 million in net outflows between June 29 and July 2, extending the withdrawal streak to eight consecutive weeks. Persistent outflows suggest that institutional investors continue to reduce exposure amid the ongoing market uncertainty.
ETF flows are worth watching as they reflect broader institutional demand for Bitcoin. Significantly, sustained net outflows can accelerate selling pressure, particularly if fund managers need to liquidate the asset to meet investor redemptions.
Moreover, ETF activity is not the only factor influencing price movements; prolonged withdrawals might weaken the market sentiment and reduce buying momentum.
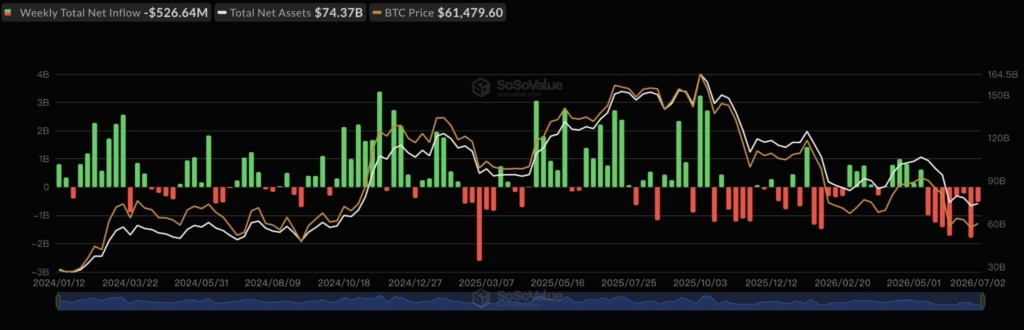
BTC has managed to hold above the $60K level despite the recent outflows, indicating that the buyers are defending key support. Also, the lack of new institutional inflows may limit the strength of near-term recovery. Unless demand improves, Bitcoin could continue trading in a volatile range.
Consistent net inflows would likely strengthen the bullish momentum, while continued withdrawals could keep Bitcoin under pressure, and it makes the sustained upside moves more difficult.
Where is Bitcoin Momentum Heading?
Bitcoin is currently trading within the $63,143 mark, and its market cap sits at $1.26 trillion. In addition, the asset’s 24-hour volume is found at $21.15 billion, after it rose by over 20.72%, as per CMC data.
Zooming in on the price pattern, there is a steady weak momentum in the BTC market. A failure to hold $64K could send the price back toward $60.5K. If the price action slips further, the crucial support range might be at around $62,927. Assuming Bitcoin turns the momentum green, the price could likely climb to the $63,314 resistance level.
Looking at the technical chart, the BTC/USDT trading pair reveals that the Moving Average Convergence Divergence (MACD) line is below the signal line. As both lines are above the zero line, it suggests that buying momentum is losing strength. This points to a pause in the uptrend, with the price may experience a short-term pullback.
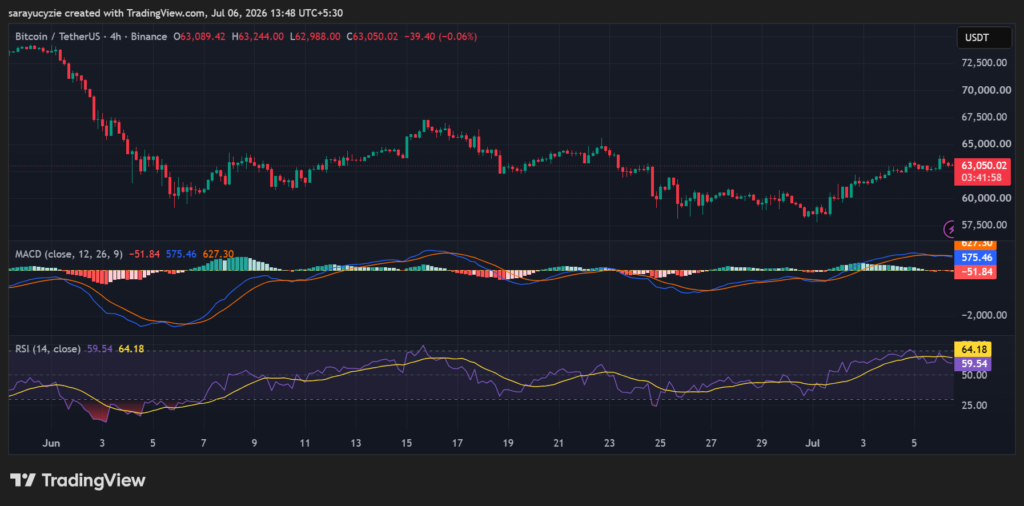
Bitcoin’s daily Relative Strength Index (RSI), positioned at 59.54, indicates moderately bullish momentum. As the reading is above the neutral level, the buyers continue to have a slight advantage. At the same time, it remains below the overbought zone, with still having more room for the price to move higher if buying interest stays steady.
Crypto Market Highlights