
- BTC shows a calm but narrow range; low volatility, $28.6K–$31K range.
- Long-term HODLing, bullish signs hint at historical gains.
Bitcoin, the dominant cryptocurrency by market capitalization, recently surged to $30,144 just a few hours ago, sparking excitement within the community after two weeks of anticipation. However, this surge was short-lived as the price swiftly plummeted to $29,940 within half an hour. Notably, this was followed by Novogratz, a cryptocurrency authority, sharing that insiders at BlackRock and Invesco indicate the approval of Bitcoin ETFs.
Currently, BTC is trading at $29,751, reflecting a 1.78% decrease in the past 24 hours, showcasing a battle between bullish and bearish sentiments.
Curiously, Bitcoin’s price is experiencing an unusual period of calm, with volatility indicators nearing record lows. Yet, the upward BTC price movement remains constrained within a range of $28,670 to $31,000.
Though BTC has experienced similar sideways trading in 2016 and 2019, 2023 volatility has hit multi-year lows, with the one-year realized volatility metric at levels not seen since December 2016.
Meanwhile, Analysts predict a continued bullish trend, given the established pattern and the upcoming halving. Notable figures like Adam Back, Blockstream‘s CEO, have expressed confidence in Bitcoin’s trajectory, engaging in a million-dollar wager, predicting a $100,000 BTC price by March 31, 2024.
Where Is the BTC Price Moving Ahead?
Analyzing the daily price chart reveals a temporary dip above the short-term 50-day simple moving average (50 SMA), underlining prevailing bullish sentiment, positioned at $29,406.
If the price sustains below $28,861, it could indicate a bearish resolve. This could prompt the BTC/USDT pair to decline to $26,000 and potentially $24,800.
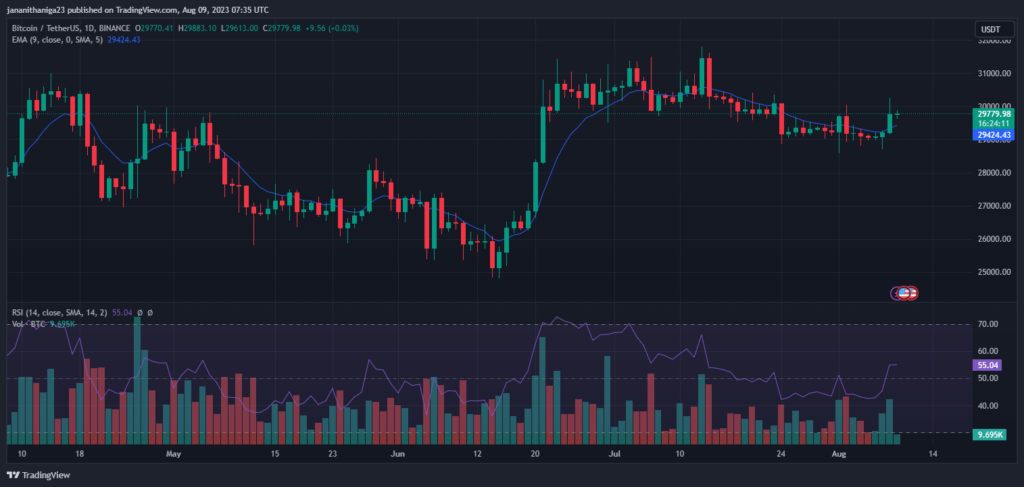
And the daily relative strength index (RSI) is at 53, potentially indicating an oversold condition. Currently, BTC trading volume is up 32.19%, totaling $18,255,572,664.
Bitcoin formed its 3rd Golden Cross on the 3D time frame!
— TheNewsCrypto (@The_NewsCrypto) August 9, 2023
But what does it mean❓
Golden Cross is a #bullish chart pattern where 50MA crosses above 200MA.
Previously when #Bitcoin made this pattern, the 200MA supported new ATHs!🚀
2016 → $BTC jumped 5178%
2019 → $BTC… pic.twitter.com/4Ci7nXZBeN
Moreover, Bitcoin recently formed its third golden cross on the 3D time frame, where the 50-day moving average (50MA) surpasses the 200-day moving average (200MA). Historically, this pattern has signaled substantial gains, as seen with BTC surging 5178% in 2016 and 700% in 2019. Different analysts and maximalists persist in recording their distinct values for Bitcoin (BTC) price prediction.
Investors HODLing
A notable shift in investment behavior is observed in recent data from leading blockchain data and intelligence provider Glassnode. It revealed that 13.3 million BTC, valued at $388.7 billion, have been inactive for over a year. It will potentially reshape the crypto market.
Bitfinex, one of the leading exchange analysts, emphasizes a strong preference among investors for long-term Bitcoin holdings. With a notable peak of 69.2%, though some dormant supply may include lost coins.
In conclusion, BTC navigates a phase of price volatility and historical indicators. Market participants remain watchful for potential bullish trends.
Will BTC be able to sustain its bullish momentum? Share your thoughts by tweeting us at @The_NewsCrypto