
- Bitcoin is currently hovering around the $68.9K level.
- The BTC market has recorded $132.83M in liquidations.
The broader bearish crypto market is painted in red, with extreme fear sentiment enduring. As the bears are strong, most of the assets are losing momentum. Notably, the largest asset, Bitcoin (BTC), has been facing rejections back-to-back and slipped below $70K. Meanwhile, the asset has entered the extreme fear zone as the Fear and Greed Index value holds at 9.
The asset’s lowest and highest trading ranges were noted at $68,291 and $71,076, respectively. According to the CMC data, at press time, Bitcoin traded within $68,921 after posting a loss of 2.52%. Also, the daily trading volume is up by over 16.57%, reaching $49.82 billion. The Coinglass data reports that the BTC market has seen a liquidation of $132.83 million.
Zooming in on the 4-hour price chart of the BTC/USDT pair, a bearish trading pattern has formed. The price could fall back to the $68,719 support. Upon a deeper correction on the downside, the bears might send the price even lower toward $68,520.
On the flip side, if the active momentum reversed, the Bitcoin price might move up and break above the $69,115 resistance. Assuming the bulls gain more traction, the uptrend would likely drive the asset’s price toward $69,368 or even higher.
Bitcoin Charts Remain Bear-Leaning With Momentum Still Weak
BTC’s technical analysis exhibits that the Moving Average Convergence Divergence (MACD) and signal line are below the zero line, which indicates bearish momentum. As it is trading below its longer-term average, and unless the lines cross above zero, the current downside pressure may persist.
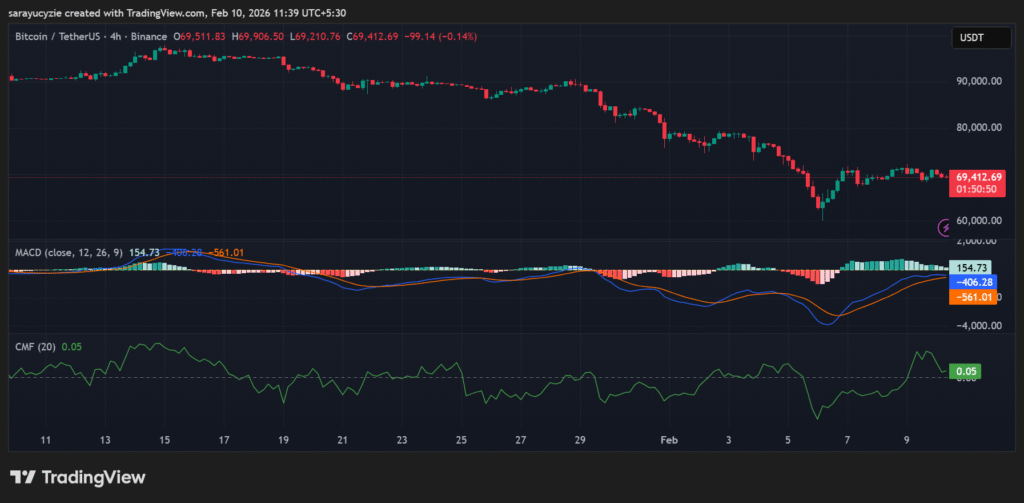
Besides, the Chaikin Money Flow (CMF) indicator value of 0.05 suggests mild buying pressure in the Bitcoin market. The capital is flowing into the asset, but the momentum is not strong yet. If it continues to rise, accumulation may build, and if it slips back toward zero, it may lack conviction.
The daily Relative Strength Index (RSI) of BTC at 45.15 signals a neutral to slightly bearish momentum. It is not oversold or overbought, but the buying strength is weak. A move above 50 hints at improving bullish momentum, while a drop lower could confirm growing downside pressure.
Moreover, Bitcoin’s Bull Bear Power (BBP) reading of -843.53 implies strong bearish dominance. The sellers are firmly in control, with the price trading below the key moving averages. Significantly, to flip the asset’s momentum positive, the value needs to start moving closer to zero.
Top Updated Crypto News