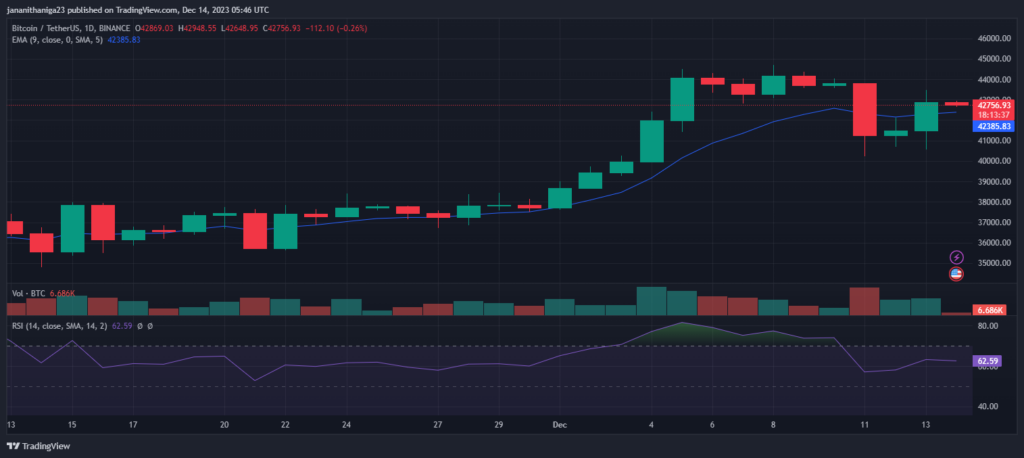
- Bitcoin faces a bullish trend with a 9-day EMA above $42379.
- Resistance at $44.5k prompted Bitcoin’s third sharp sell-off—GlassNode.
Bitcoin, the leading cryptocurrency by market capital, has been a pivotal force over the past week, reaching $44,705—an unprecedented peak in nearly two years. However, the recent two-day spell marked a slight volatility, causing the price to fluctuate within the $42,000 to $40,000 range. Today, BTC has surged by 5%, trading at $42,778.
This surge coincides with promising news in the Bitcoin ETF domain. Bitwise, a major investment firm, has successfully listed its Spot Bitcoin ETF on the DTCC under the ticker $BITB. This development has significantly influenced the global market cap, surging by 5% in the last 24 hours.
Amid this market activity, Glassnode, a prominent crypto data aggregator, notes that despite the strong uptrend, Bitcoin faced resistance this week, reaching a yearly high before encountering the third sharpest sell-off of 2023.
Moreover, several on-chain pricing models indicate that the ‘fair value’ based on investor cost and network throughput lags, fluctuating between $30,000 and $36,000. Notably, the recent appreciation prompted short-term Bitcoin holders to capitalize on profits, temporarily halting the ascent.
Regarding whales—the significant holders of BTC—IntoTheBlock’s latest data highlights a substantial increase in net-flow this week. As the Bitcoin price experienced a decline, these whales seized the opportunity, accumulating a total of 13,010 BTC between December 10 and 13.
Bitcoin Price Analysis
Looking at the analysis of Bitcoin’s price movements, the daily chart exhibits a potentially bullish trend. The 9-day exponential moving average (EMA) currently stands above the trading price at $42,379. However, the daily relative strength index (RSI) indicates an overbought condition, registering at 62.

For potential scenarios, if the price surpasses the $43,400 level, it may ascend to test the $44,770 resistance level. Conversely, a dip below the $40,550 mark could lead to a test of the $39,370 support level.


