
- BGB has surged 3.21% in 24 hours, trading at $5.01 after weeks of bearish momentum.
- Market indicators suggest a bullish reversal, with RSI rising and MACD shifting positive.
- BGB finds key support at $4.30, with resistance targets at $5.50 and $6.55.
The crypto market has faced a major setback following the recent Bybit hack incident, which drained $1.4 billion ETH. Following the hack, liquidations worth $566 million have been observed in the market in the past 24 hours. Moreover, the global market cap declined by 1.98% to $3.17 trillion, while the 24-hour trading volume surged to $132.28 billion.
Centralized exchange token Bitget Token (BGB) has been undergoing a correction following its recent remarkable rally. BGB witnessed a robust bullish journey in December, with its price hitting its all-time high of $8 in late December. Furthermore, the altcoin consolidated around the $6-$7 region in January.
However, following the broad market correction in late January, BGB lost the $7 key mark and has been trading on a descending channel since then. The continuous bearish momentum has seen BGB drop below the $5 mark, seeking support at the $4.30 region.
At press time, BGB is trading at $5.01, up 3.21% in the past 24 hours, according to CMC data. Despite the bullish resurgence, the altcoin is down by 5% and 29% on the weekly and monthly charts, respectively. Following the bullish momentum, the market cap and trading volume have climbed to $6.01 billion and $494 million, respectively.

Will the Support Hold for a Bullish Reversal?
Looking at BGB’s daily chart, indicators display a shift in market dynamics as the price movement gears up for a new rally. BGB has formed a major support at the $4.30 region which has led to a breakout from the descending channel.
Should the current trend hold, the rally from the breakout could lead to a retest at the $5.50 region. The continuation of the rally could pave the way for a retrace at the $6.55 mark and later challenge the key resistance at $7.80.
The Relative Strength Index (RSI) and Moving Average Convergence Divergence (MACD) indicators support the bullish reversal price movement. The RSI steadily rises from the oversold region, indicating a decrease in selling pressure as the buyers take the lead. Should the bullish play hold, the RSI could climb into the neutral region, leading to successful resistance breakouts for BGB’s price movement.
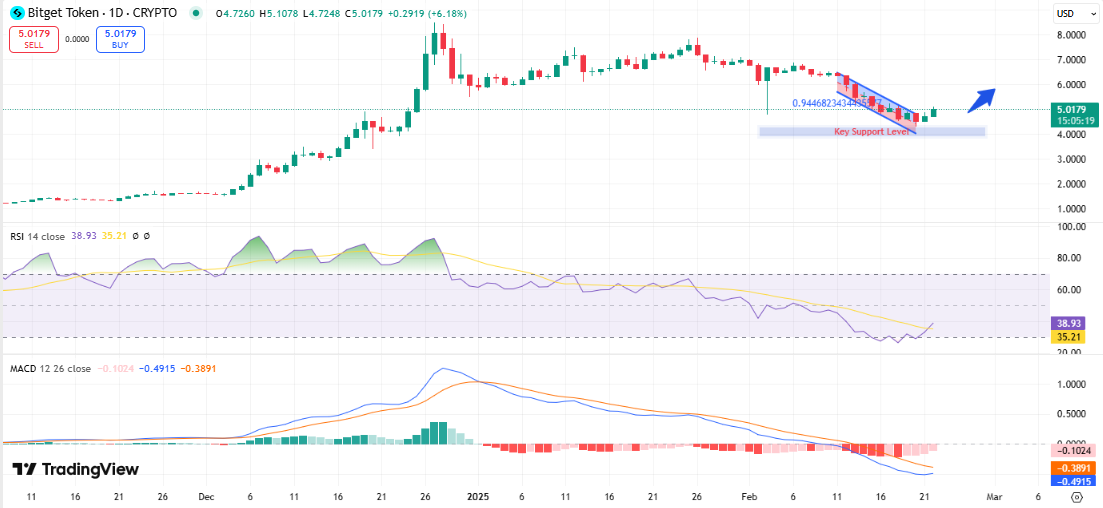
Furthermore, the MACD indicator is changing its negative outlook as the red bars fade away from the histogram. The MACD line has changed its downward direction and is trending upwards, ready to make a bullish crossover above the signal line.
However, a shift from the bullish reversal thesis leading to a drop below the $4.30 region could lead to a further correction to the $4.0 mark.